
StoryTime,
A Data Literacy Tool
-
We are continuously capturing data from the world around us. This data is harnessed in numerous ways to push the boundaries of human understanding and ability. The lack of data literacy, or the understanding of the basic concepts of handling data, is still a significant roadblock. SAS, a leader in Analytics, has a goal of improving data literacy starting early in school. In collaboration with SAS, our goal was to explore creative tools to improve data literacy among a range of users starting with middle schoolers.
-
Our goal was to develop a tool that would explain a data concept-correlation-and its relevance to understanding a sample data set, allowing users to realize the importance of data literacy. First, we conducted a number of interviews with middle school students and teachers to better understand our users. We learned middle schoolers enjoy narratives, have short attention spans, and want to know why the concepts they are learning are relevant. We developed a digital learning tool-for a tablet-that would keep kids engaged while they improve their data literacy skills.
-
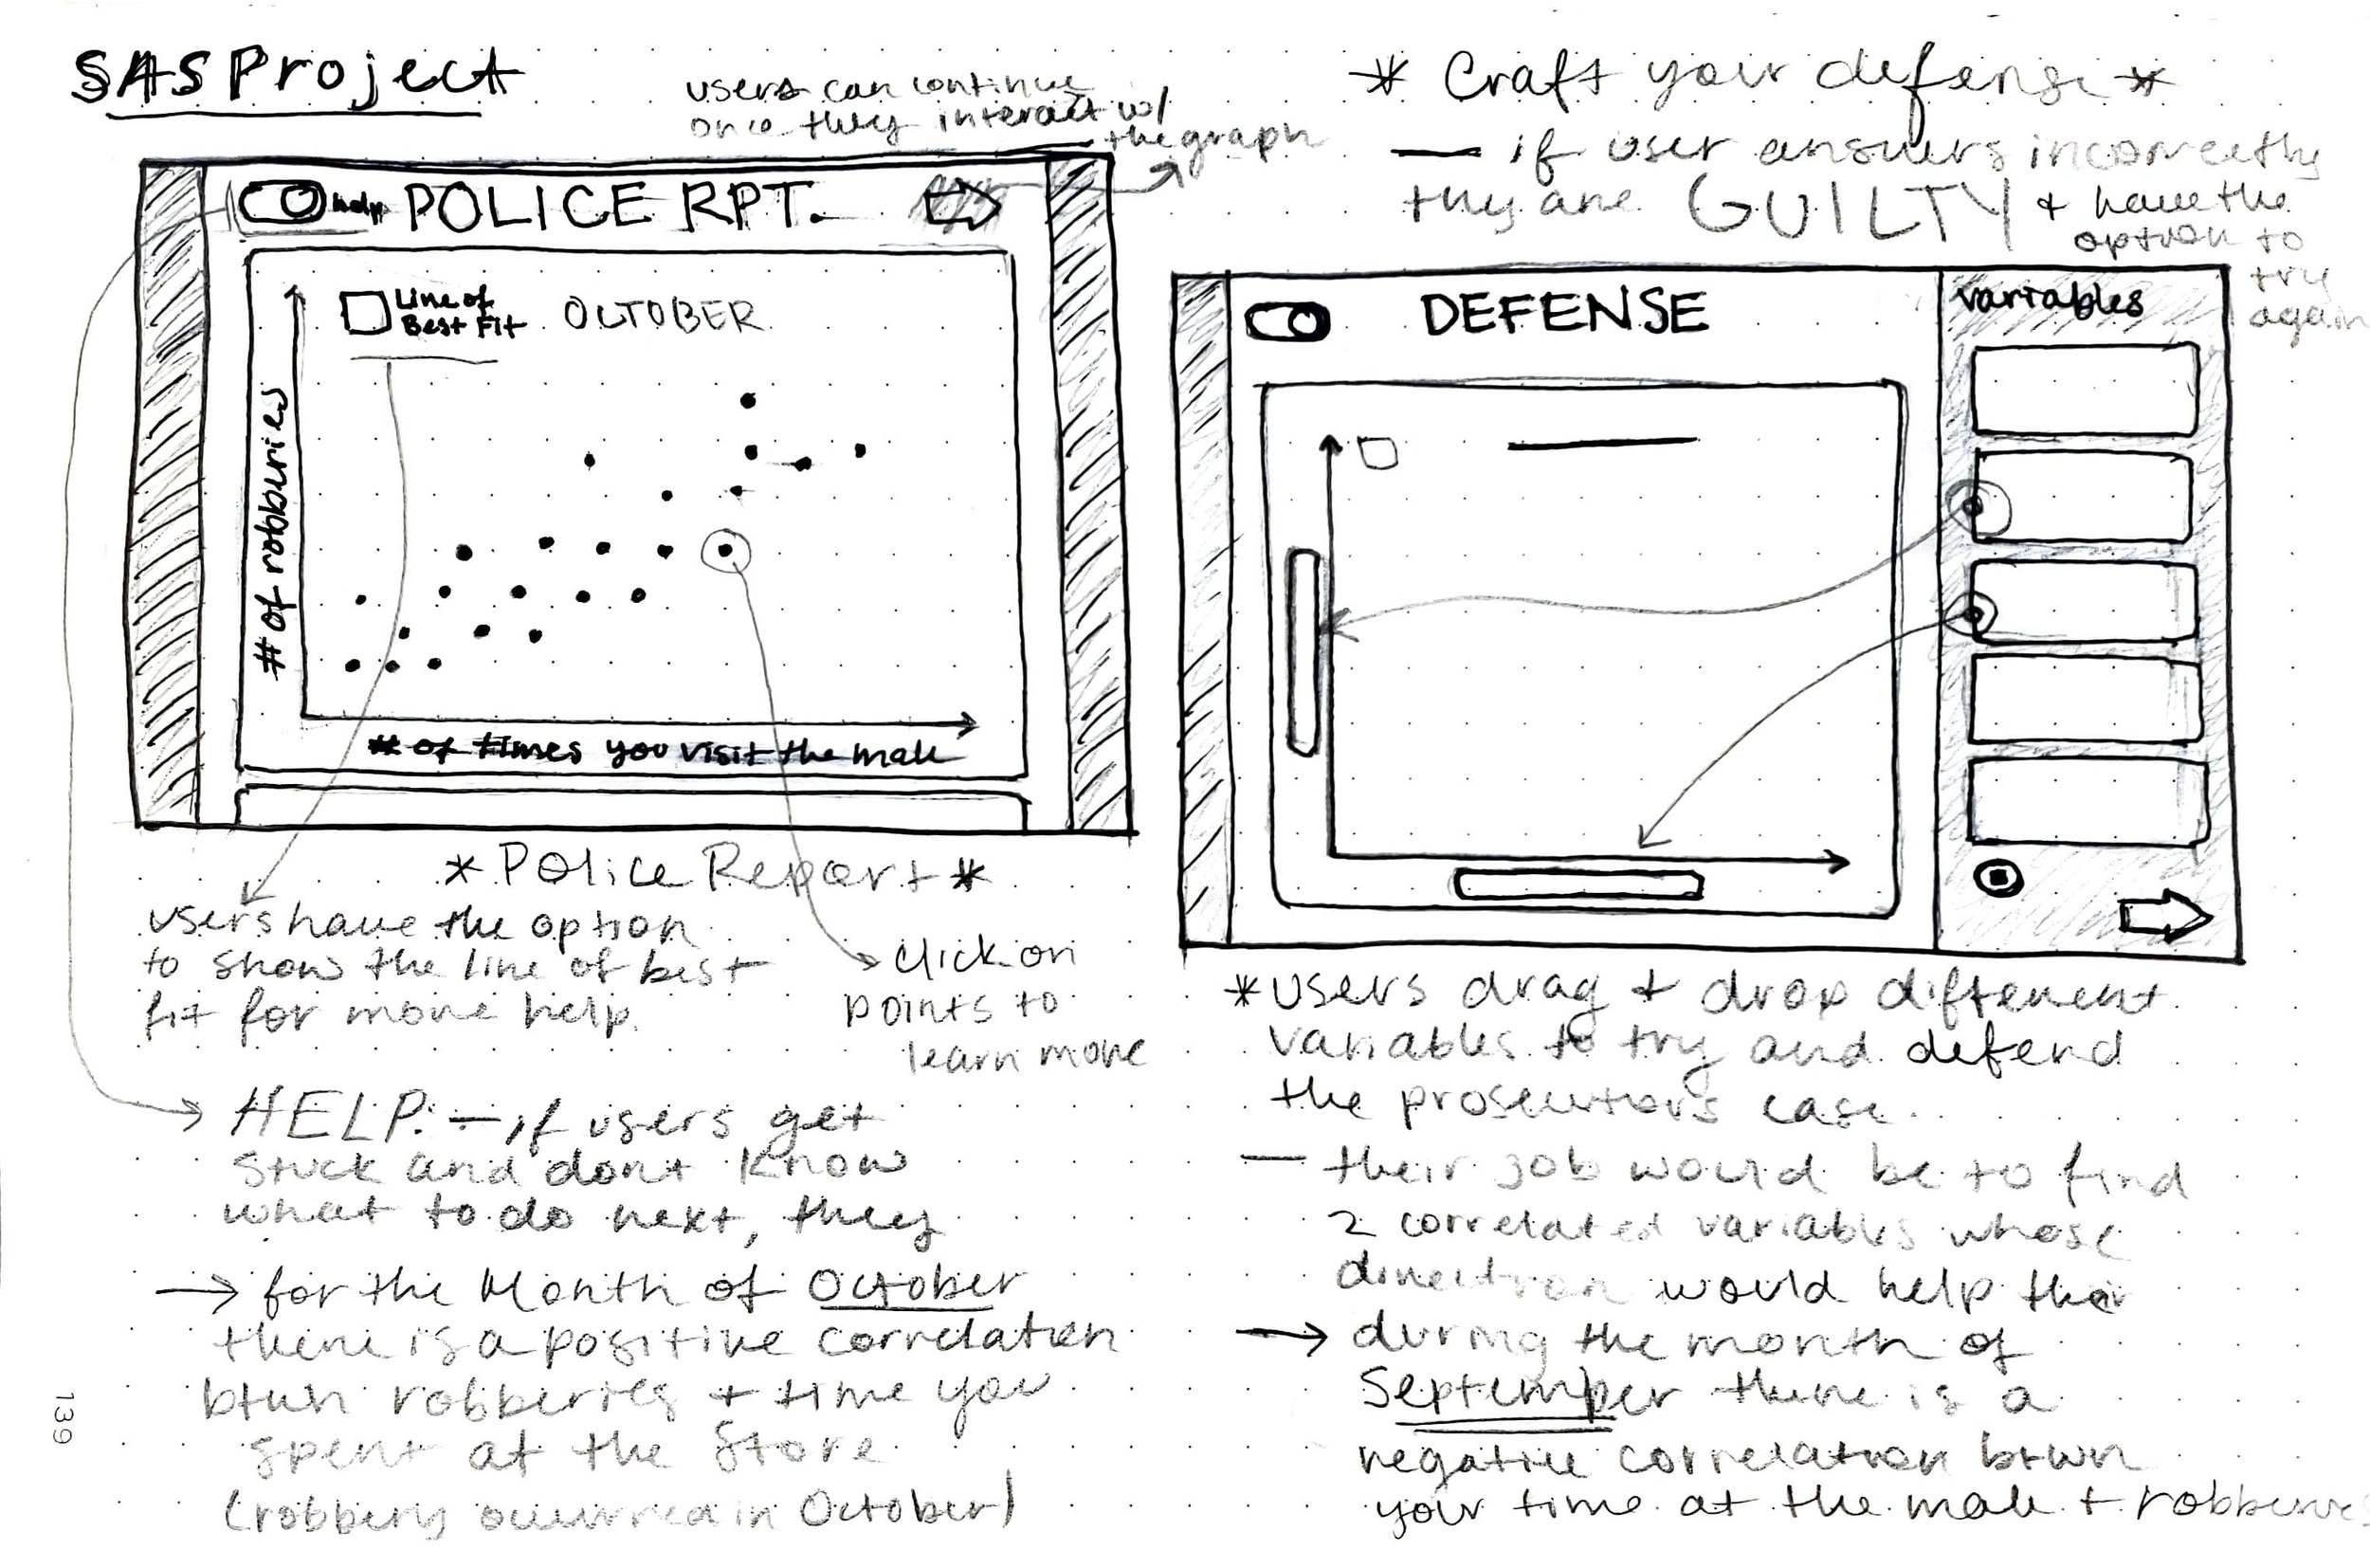
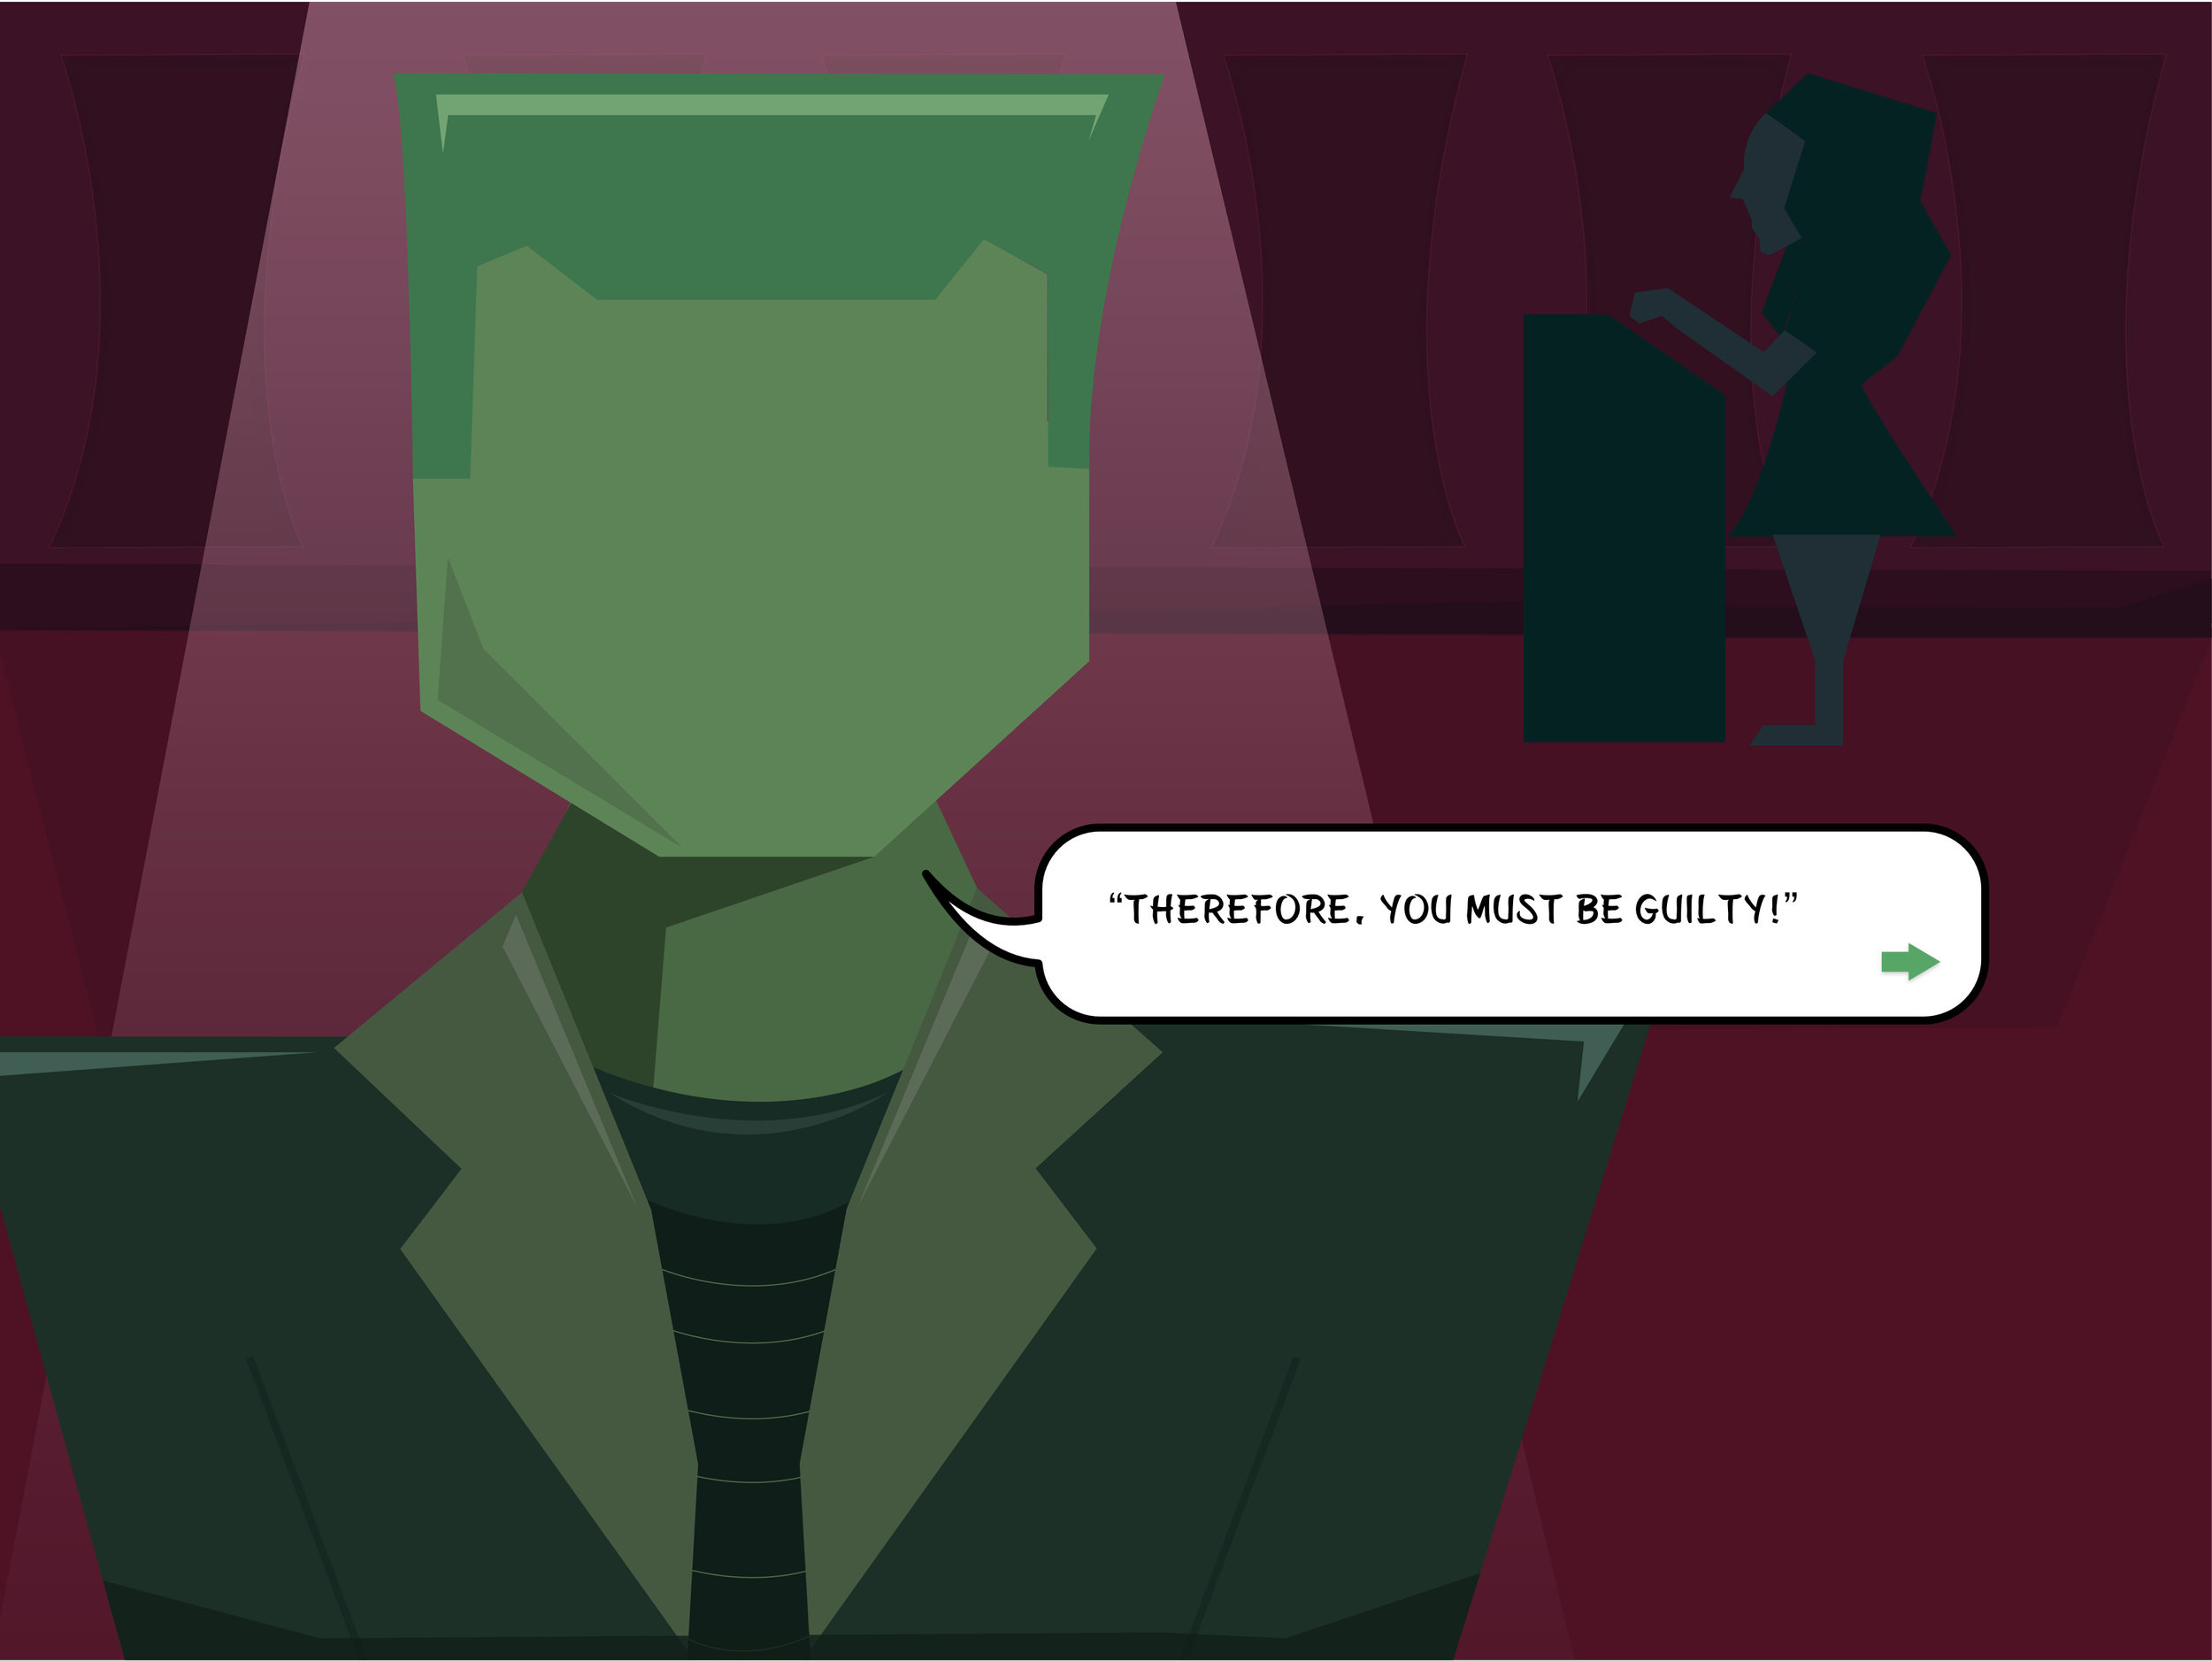
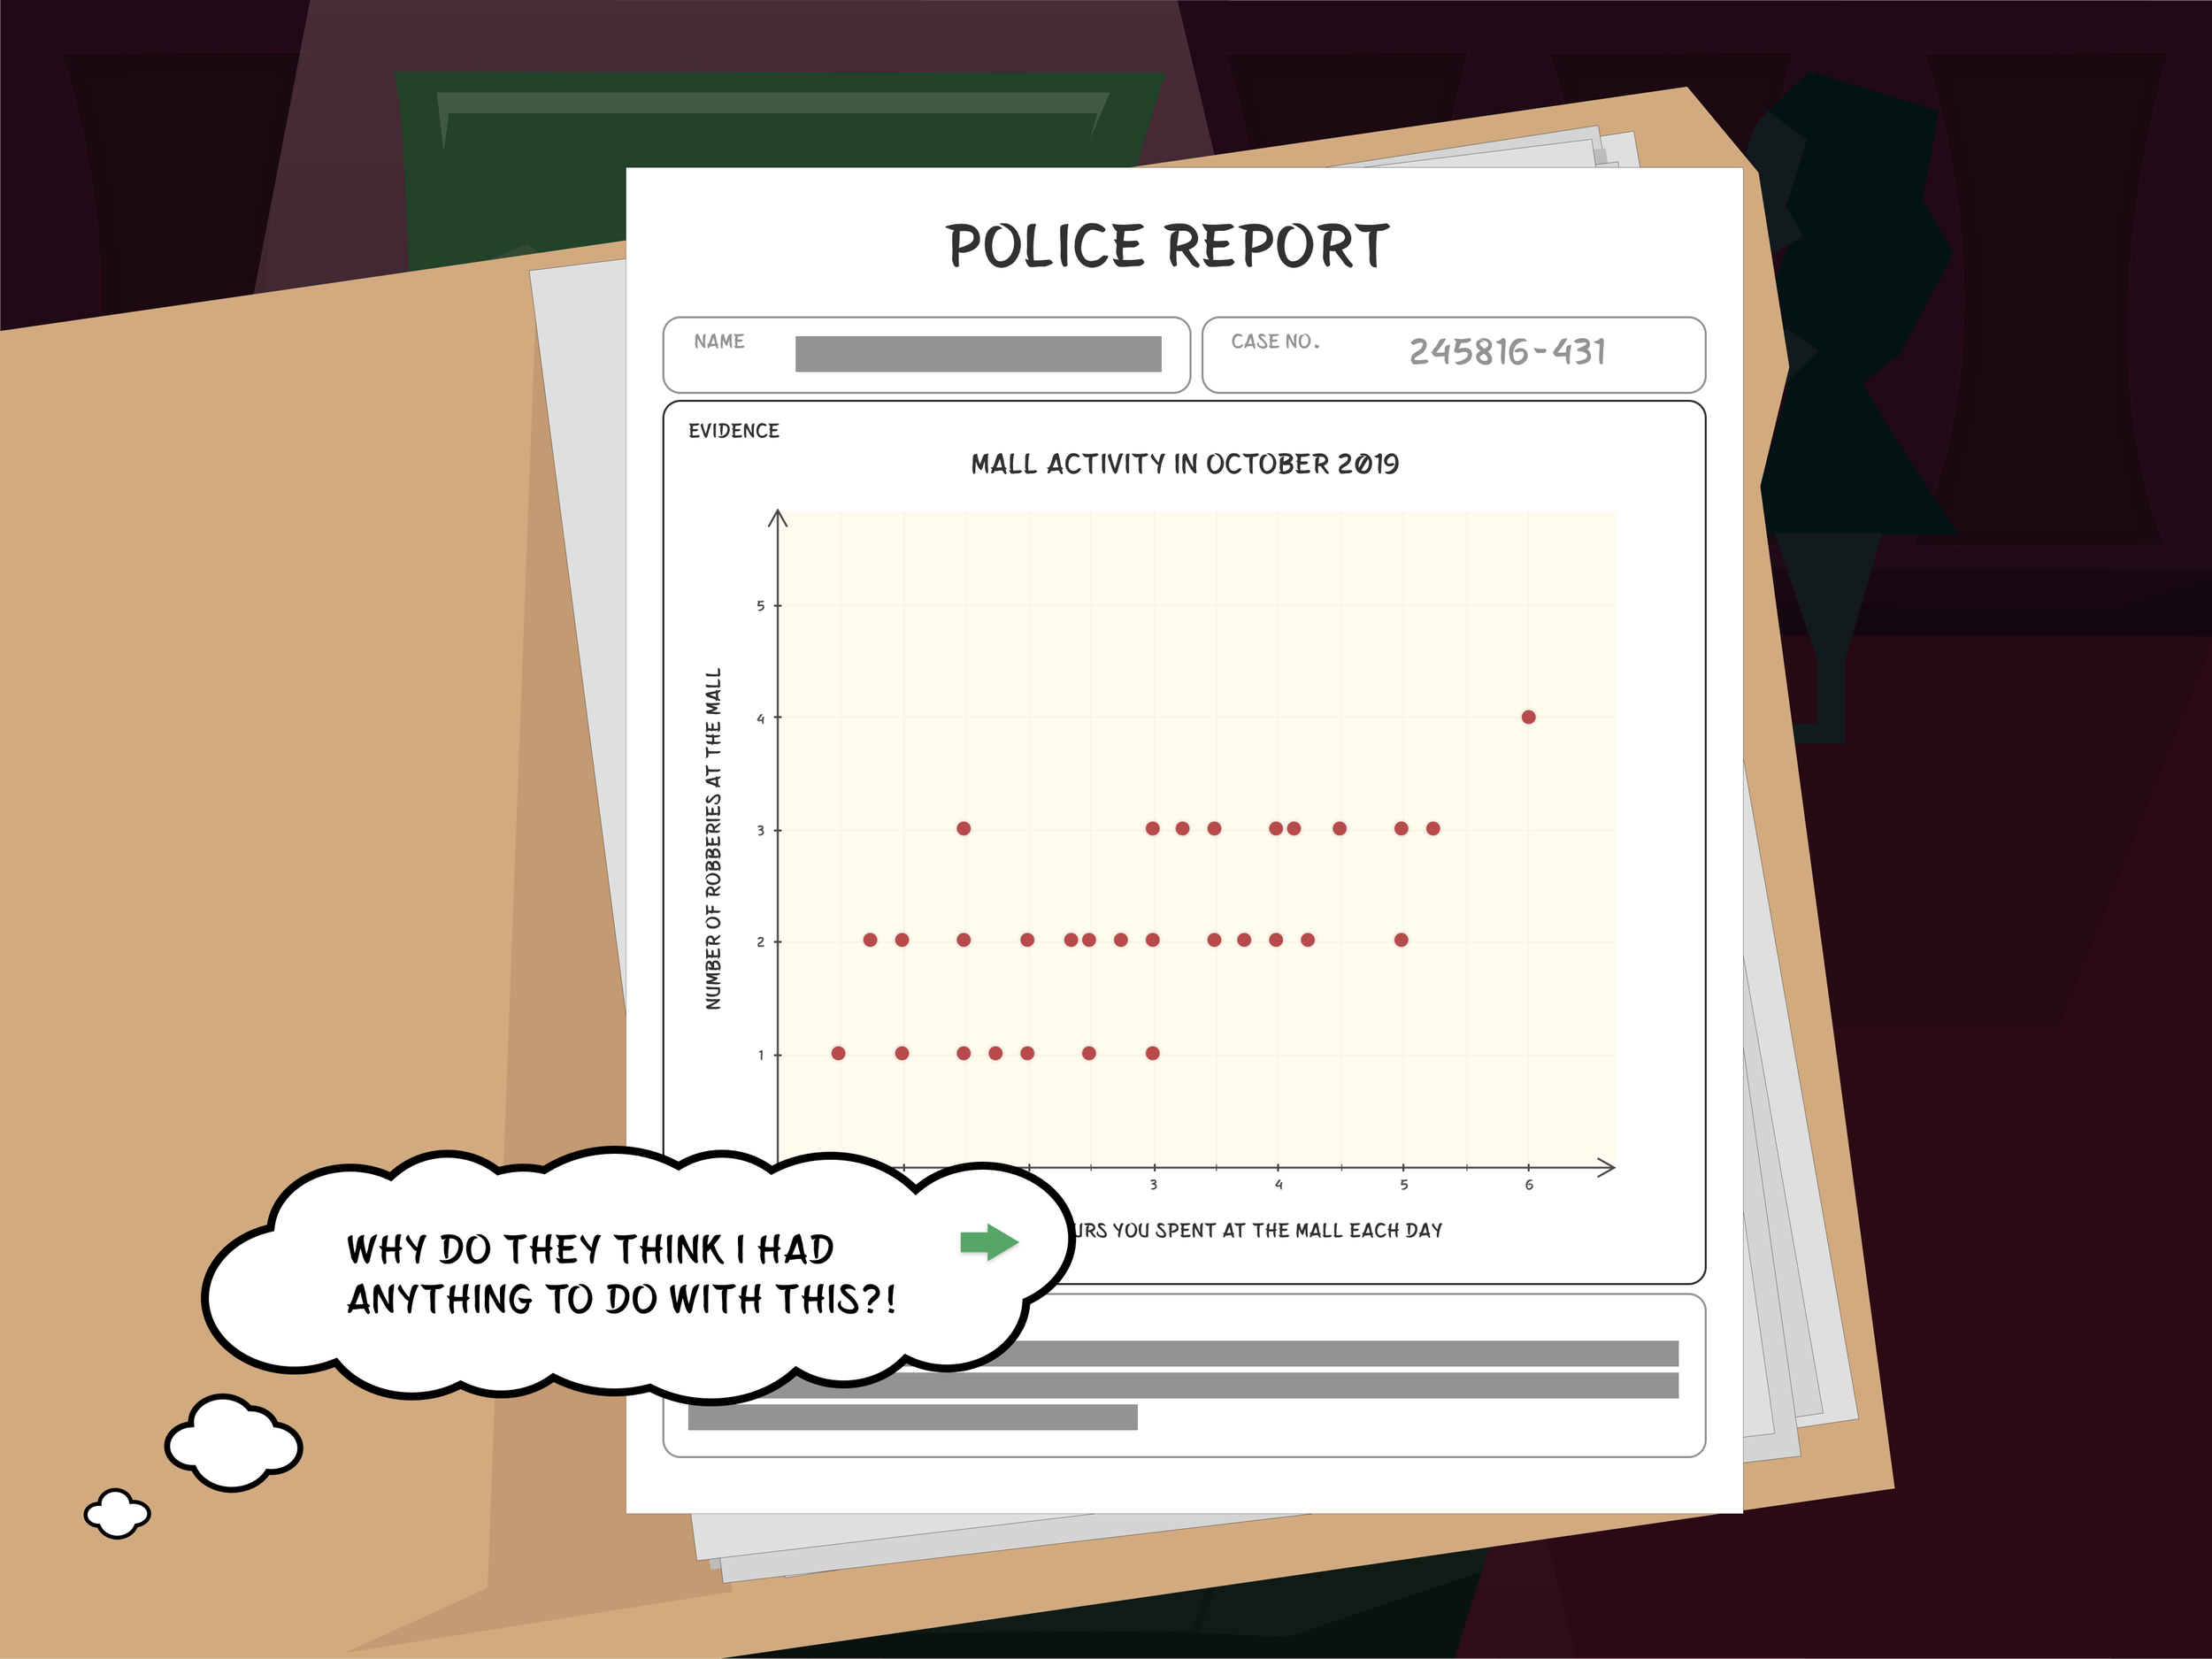
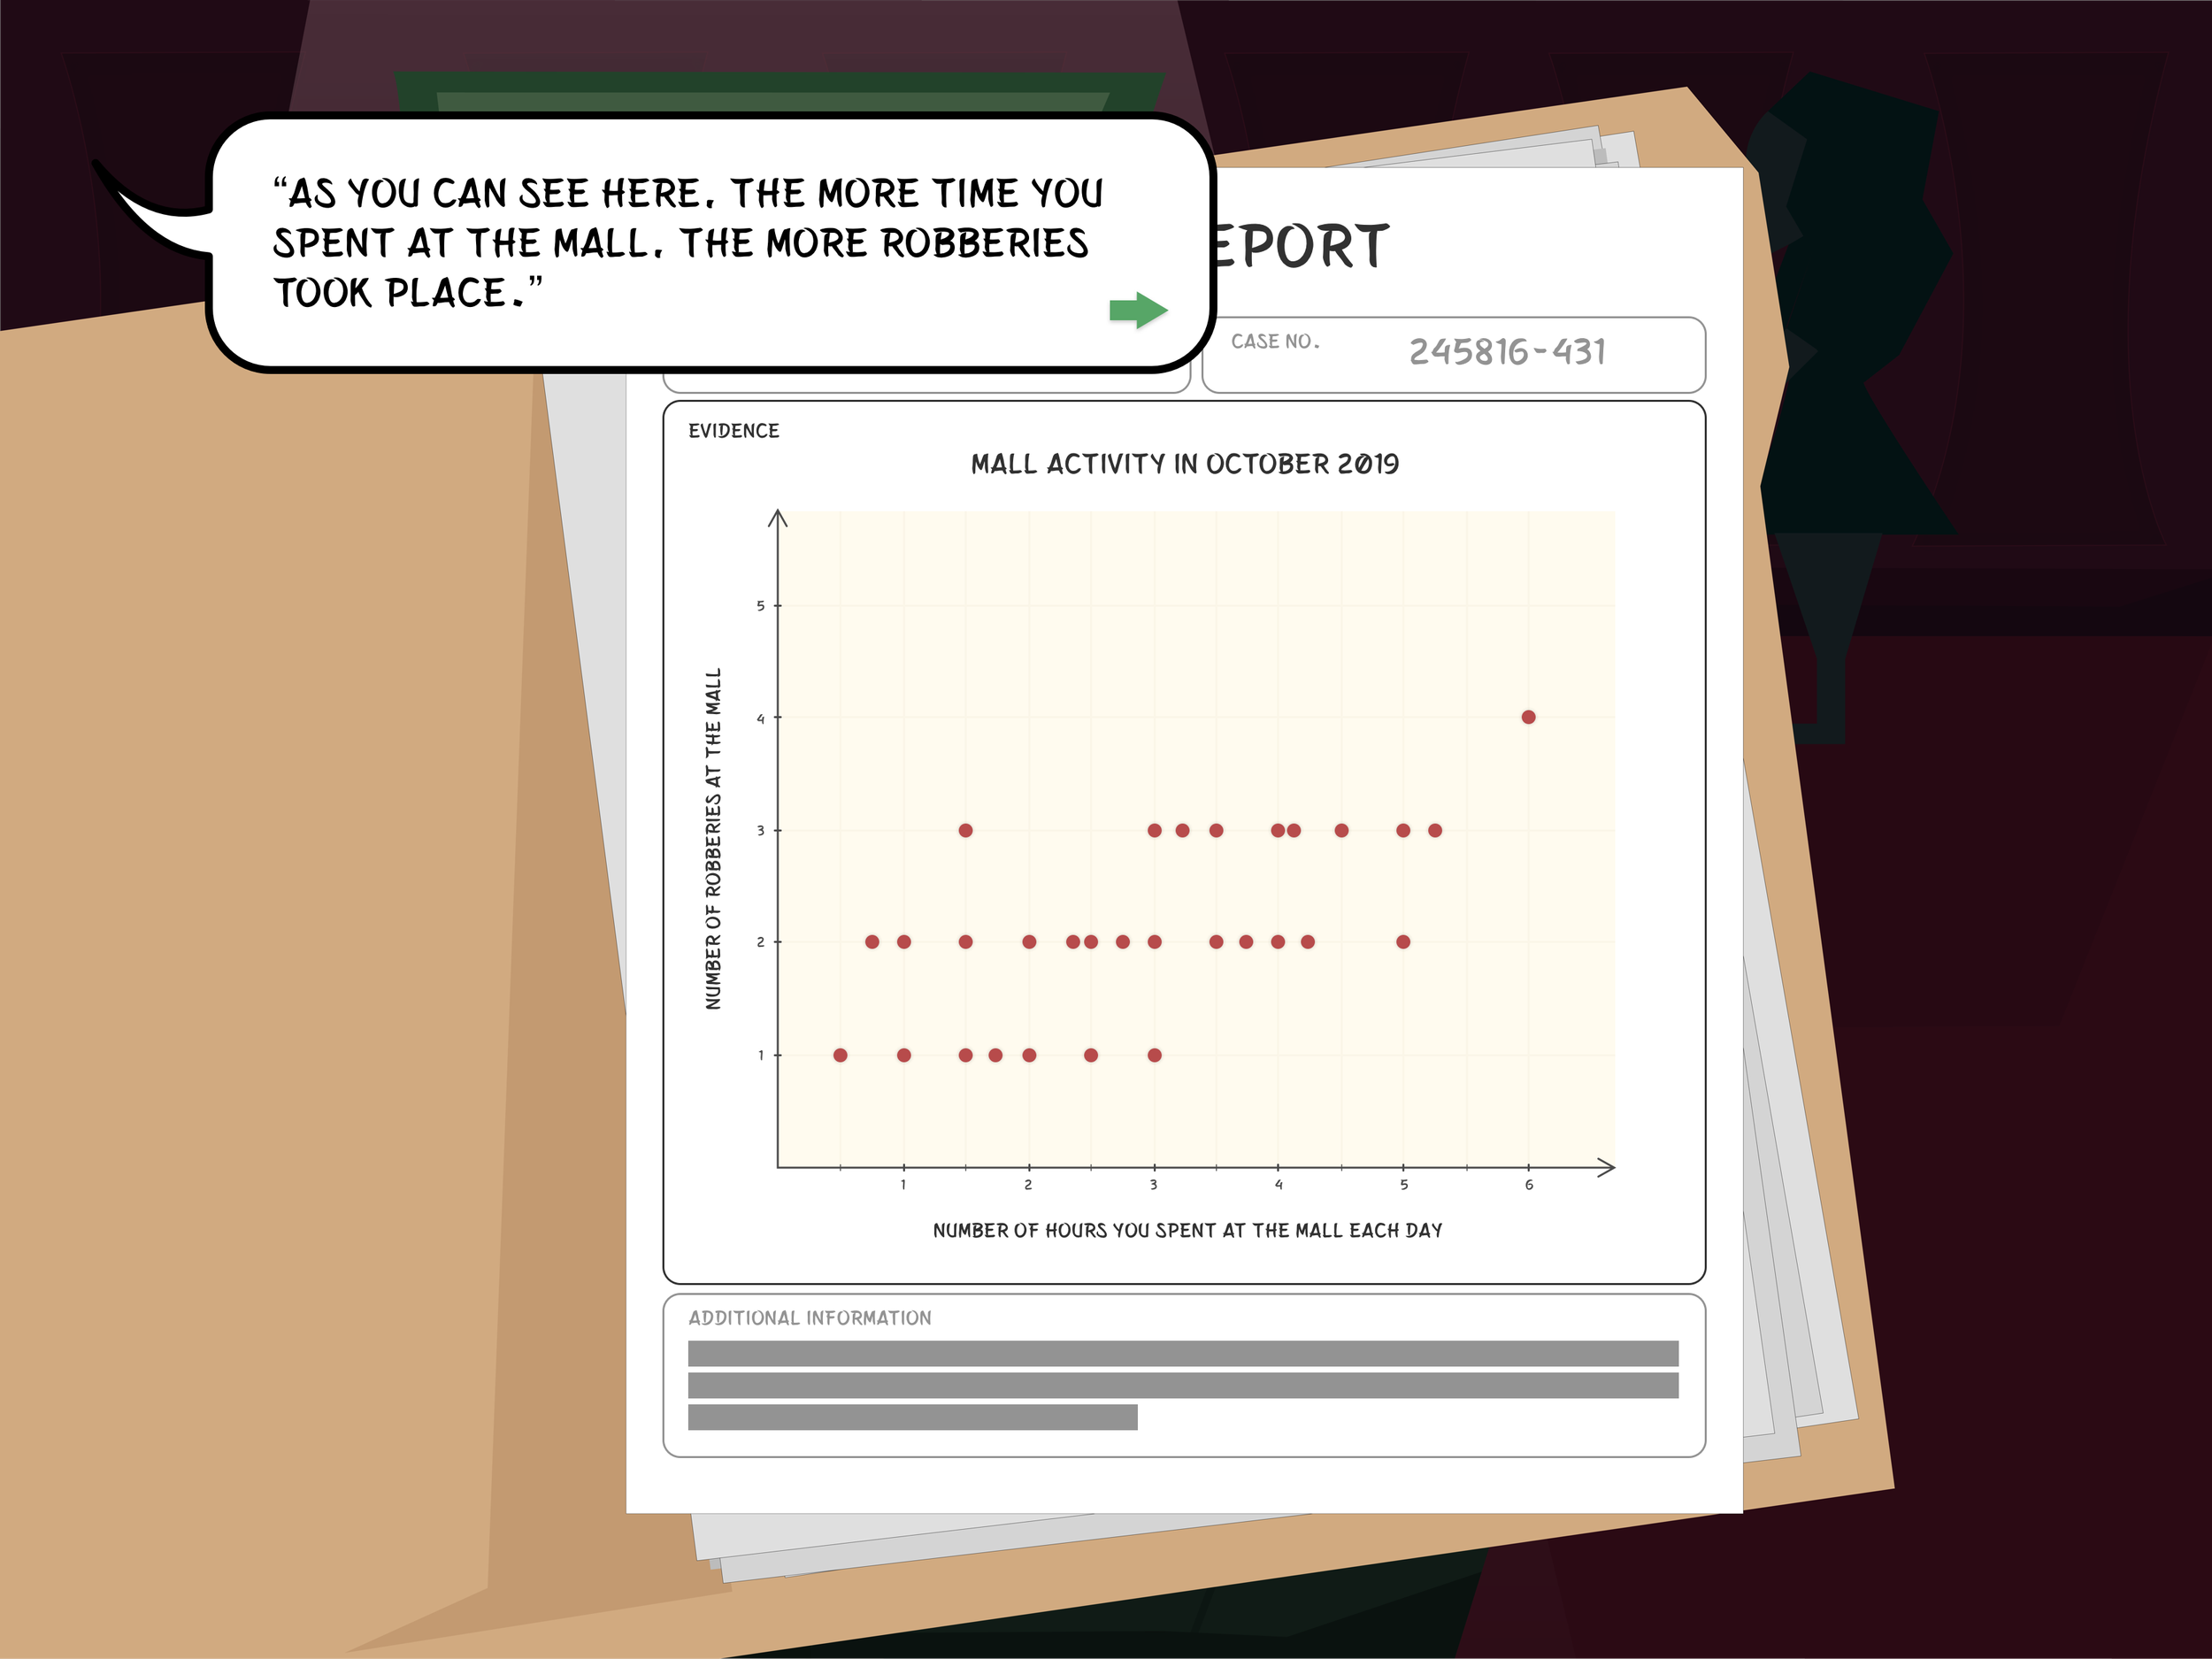
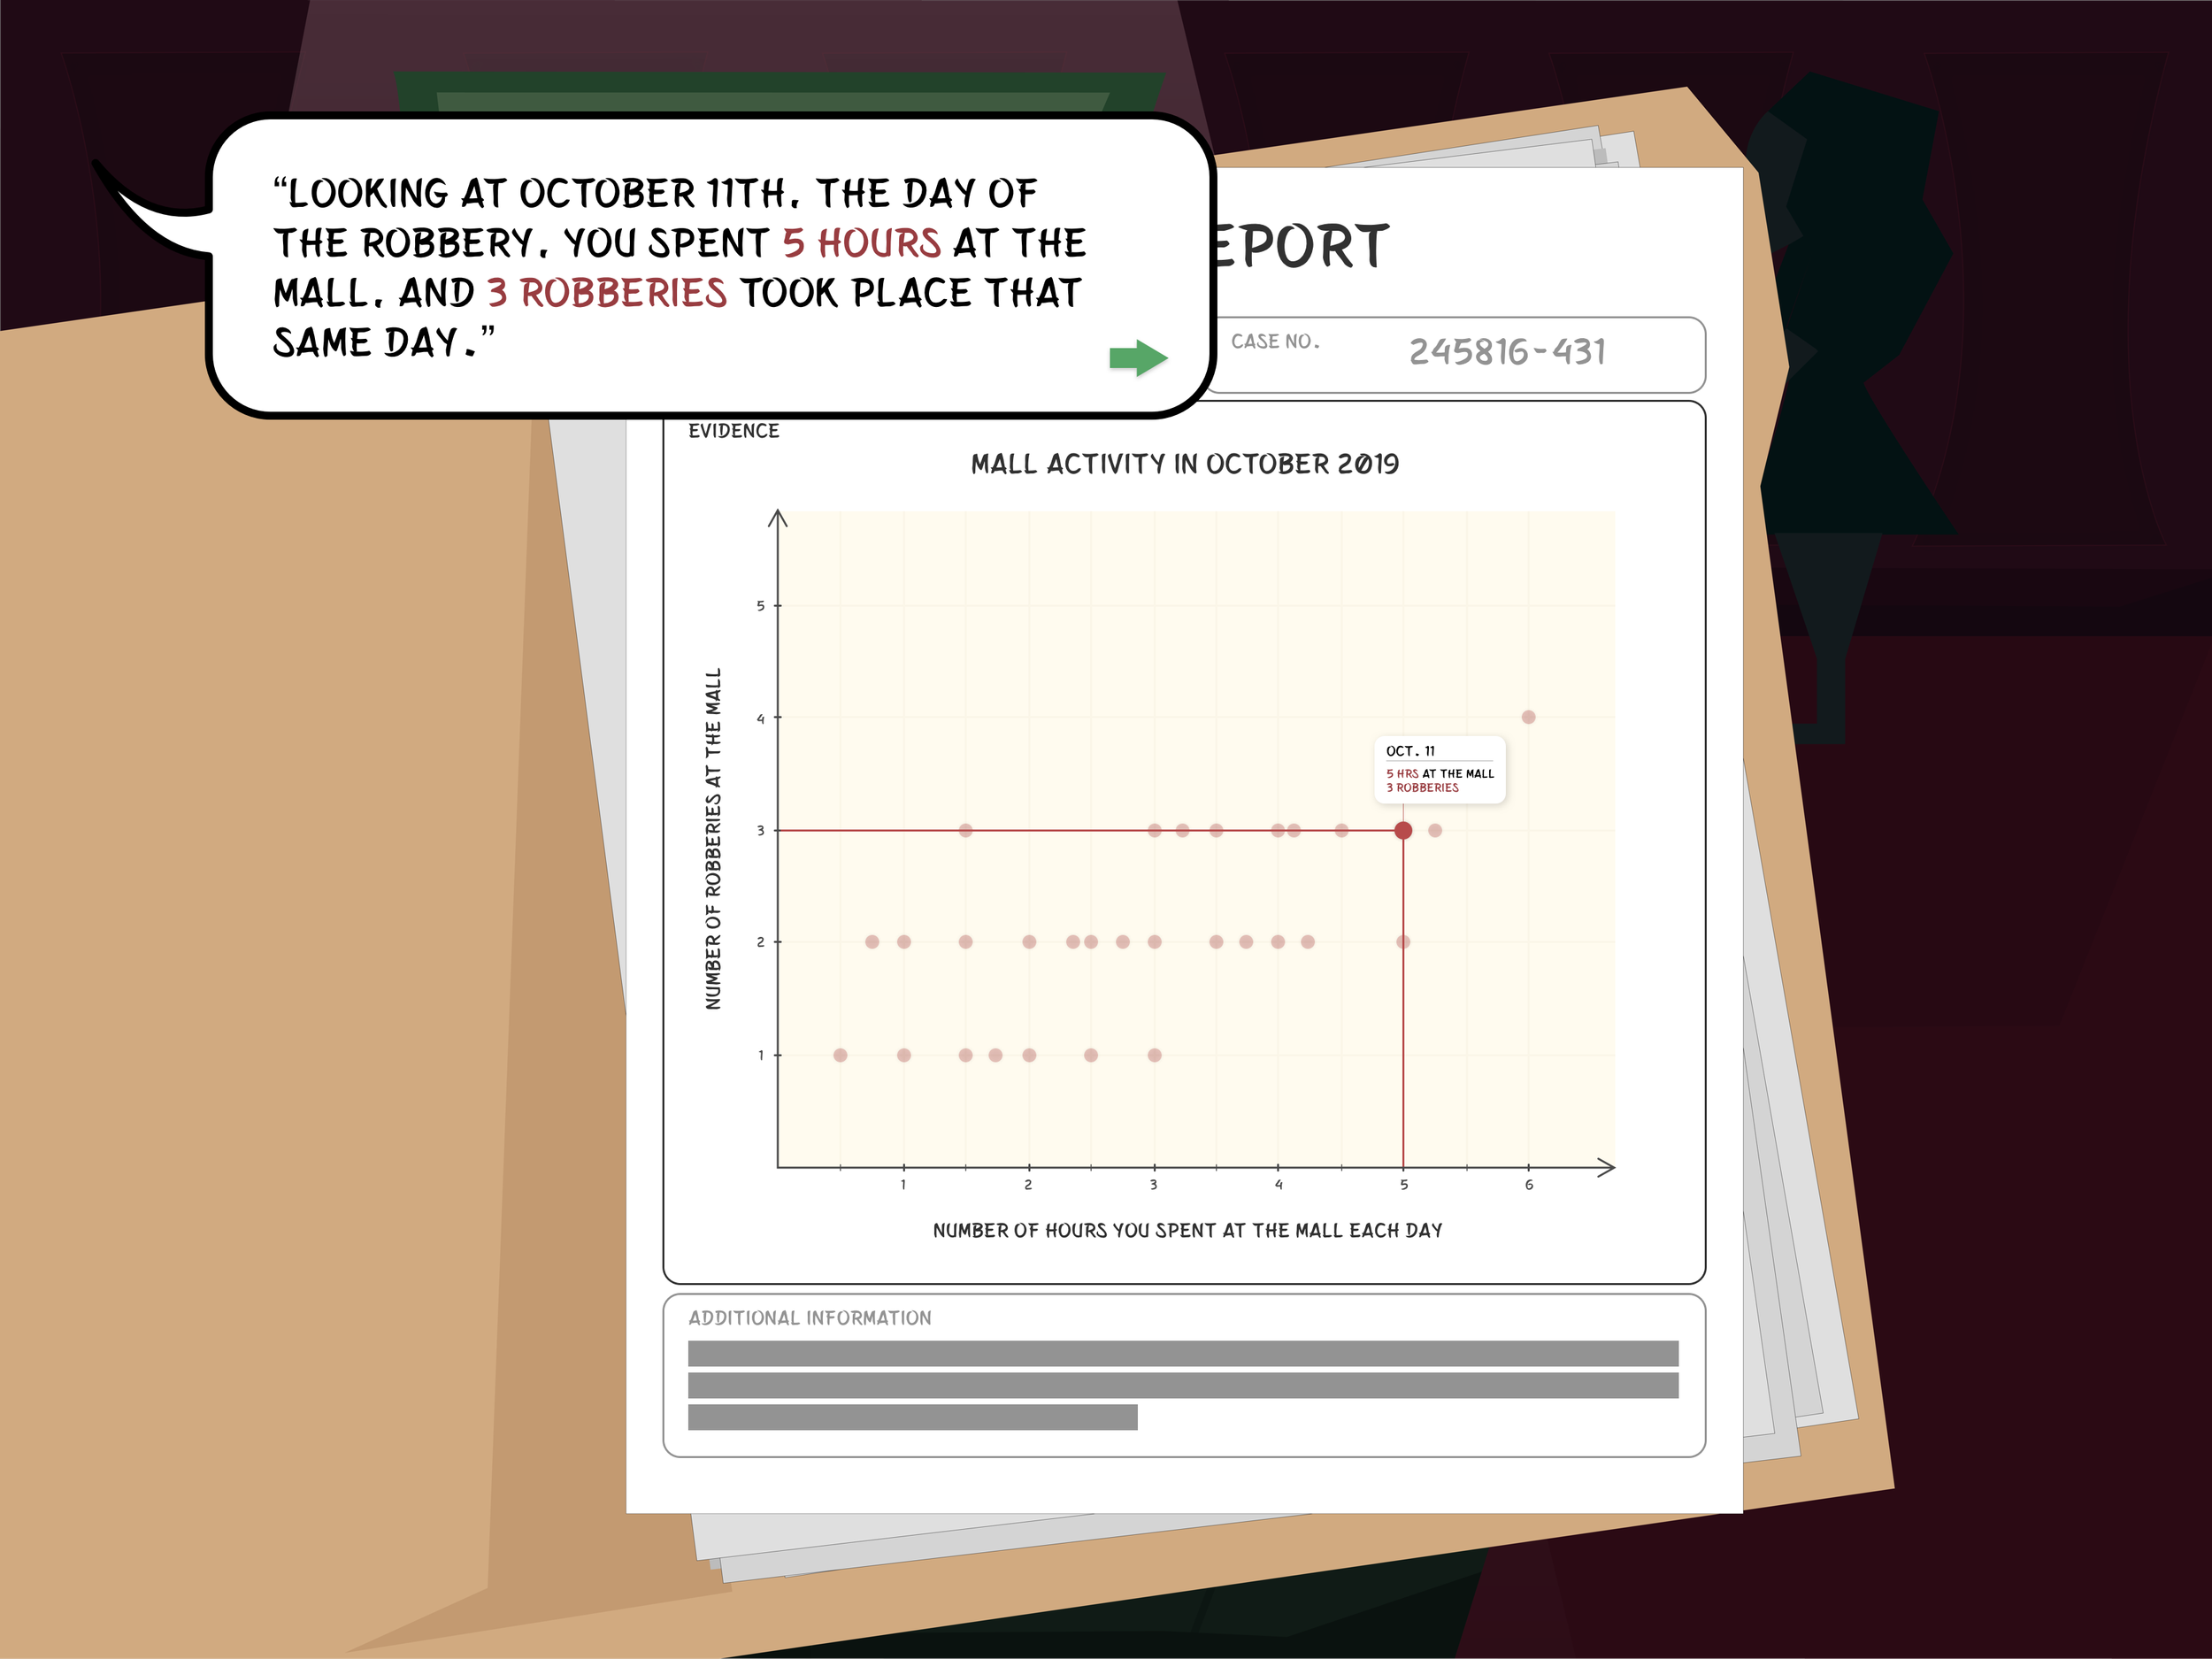
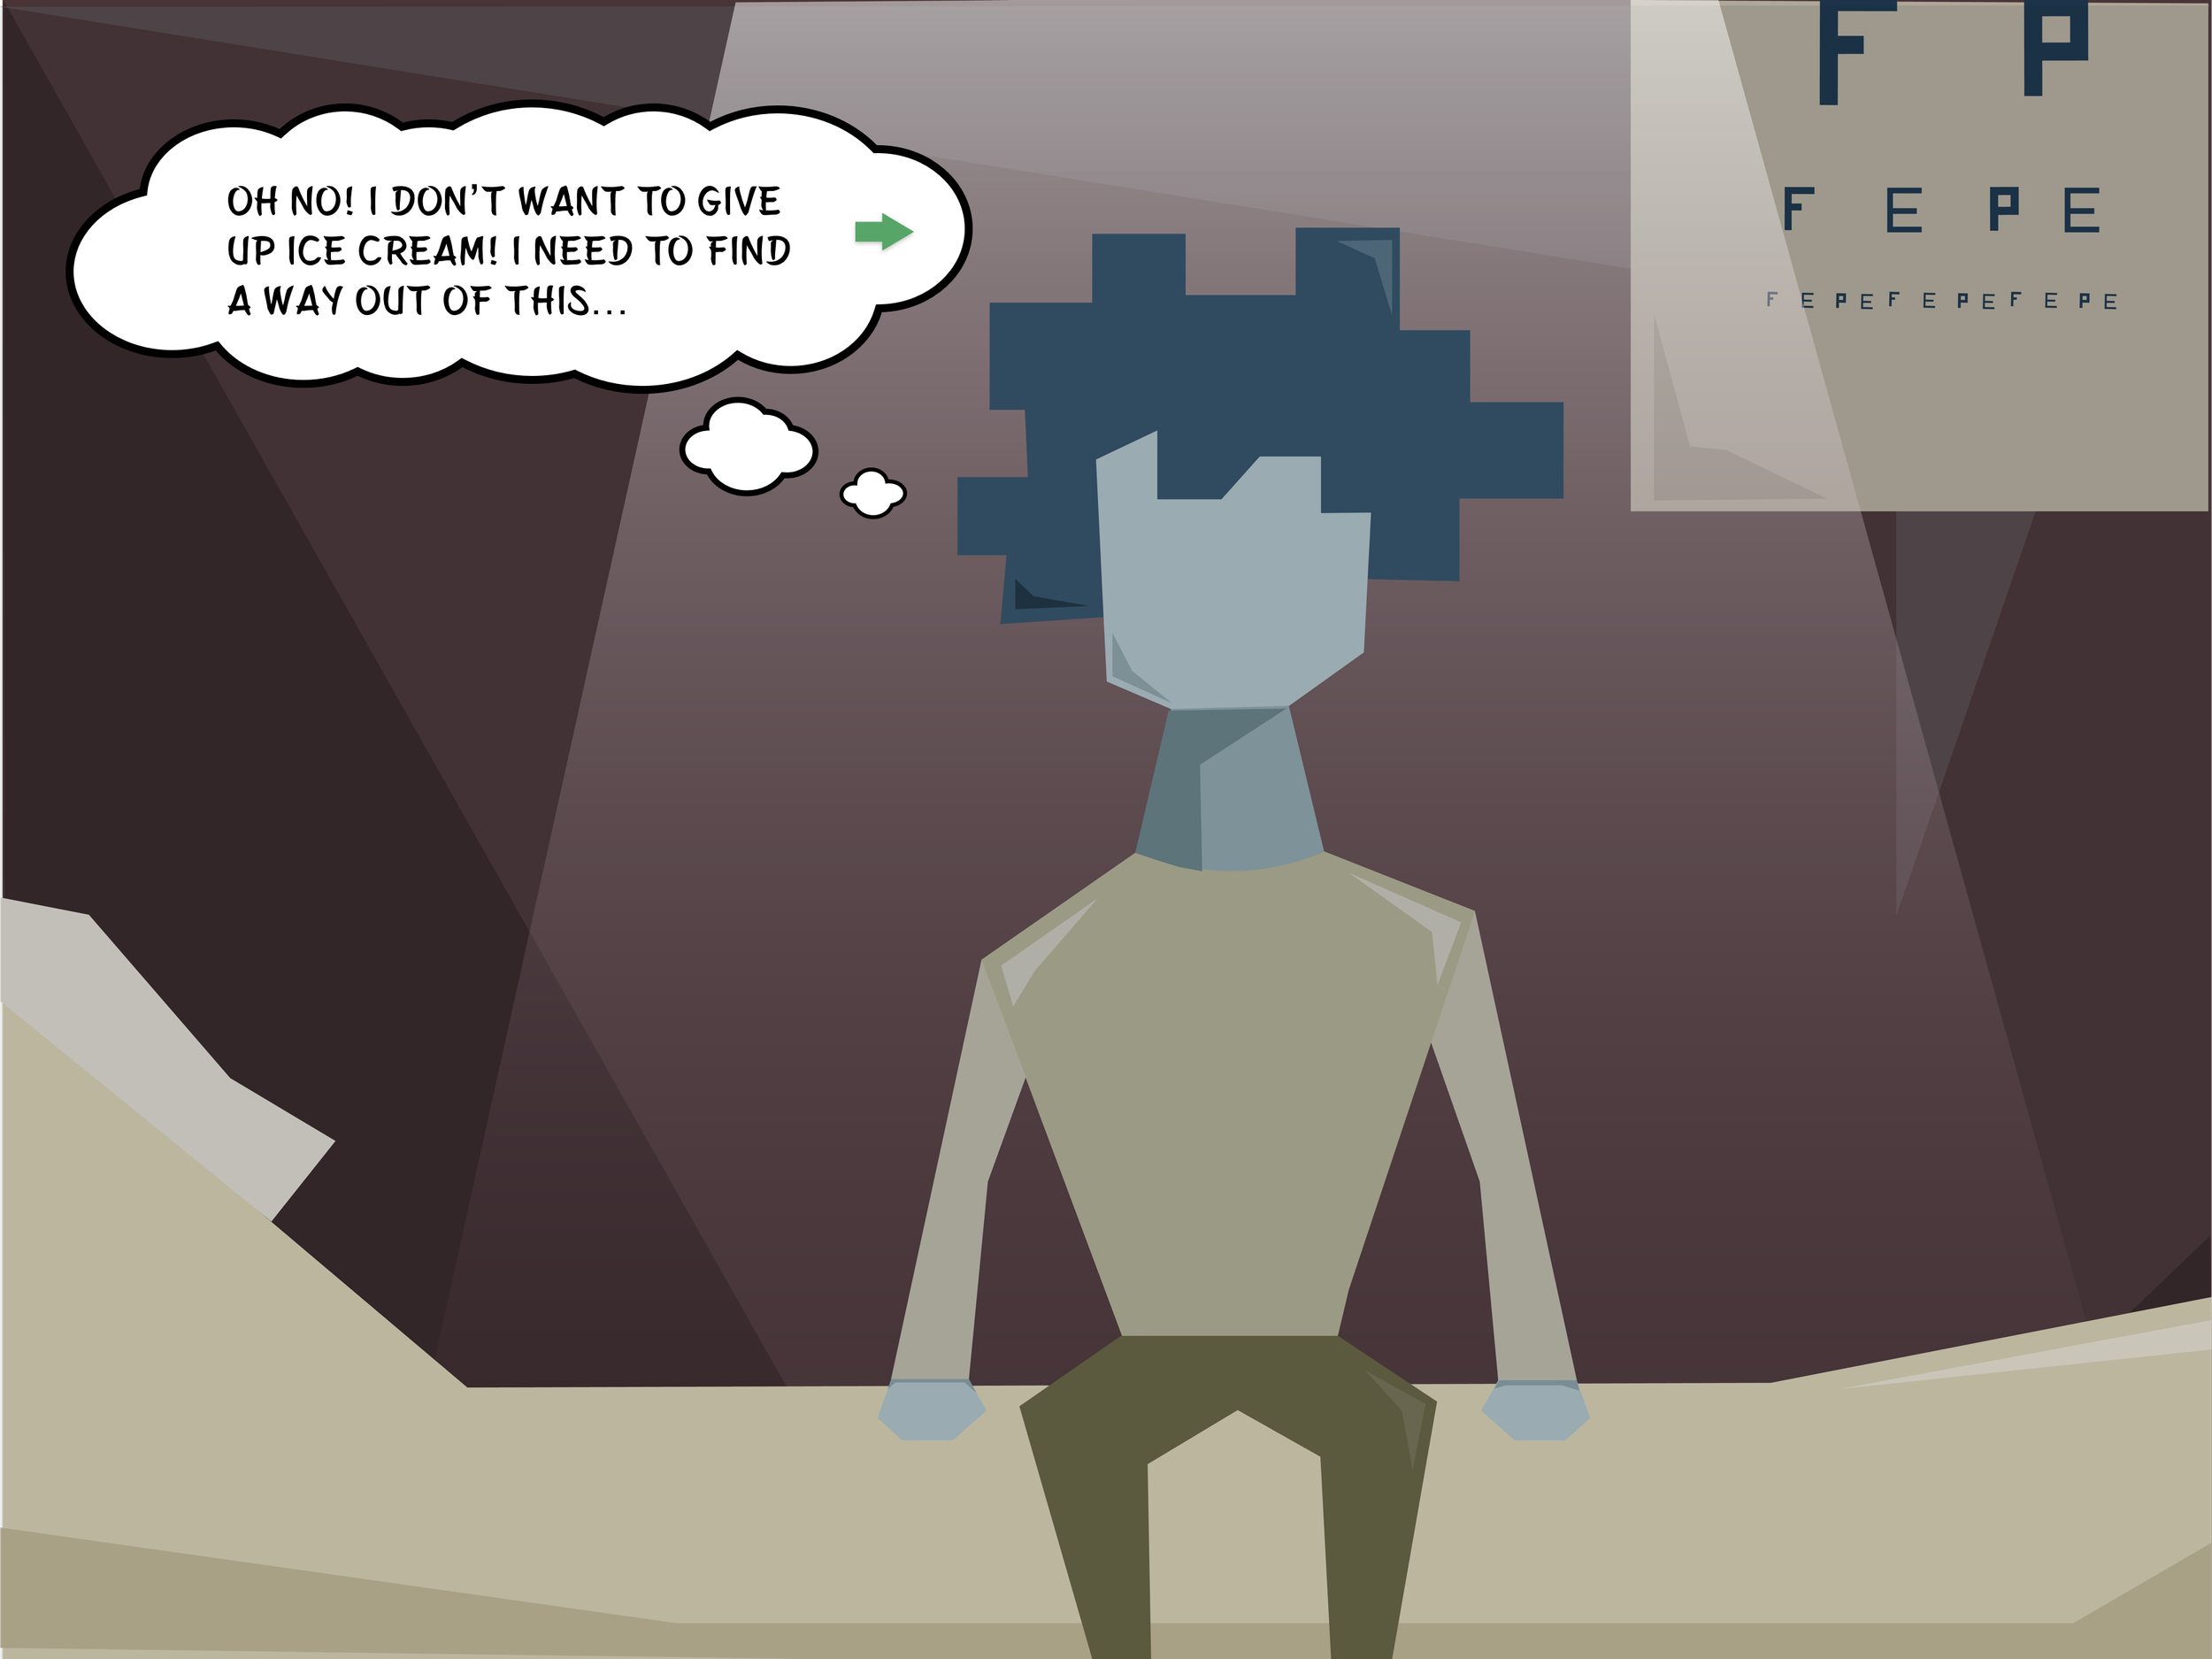
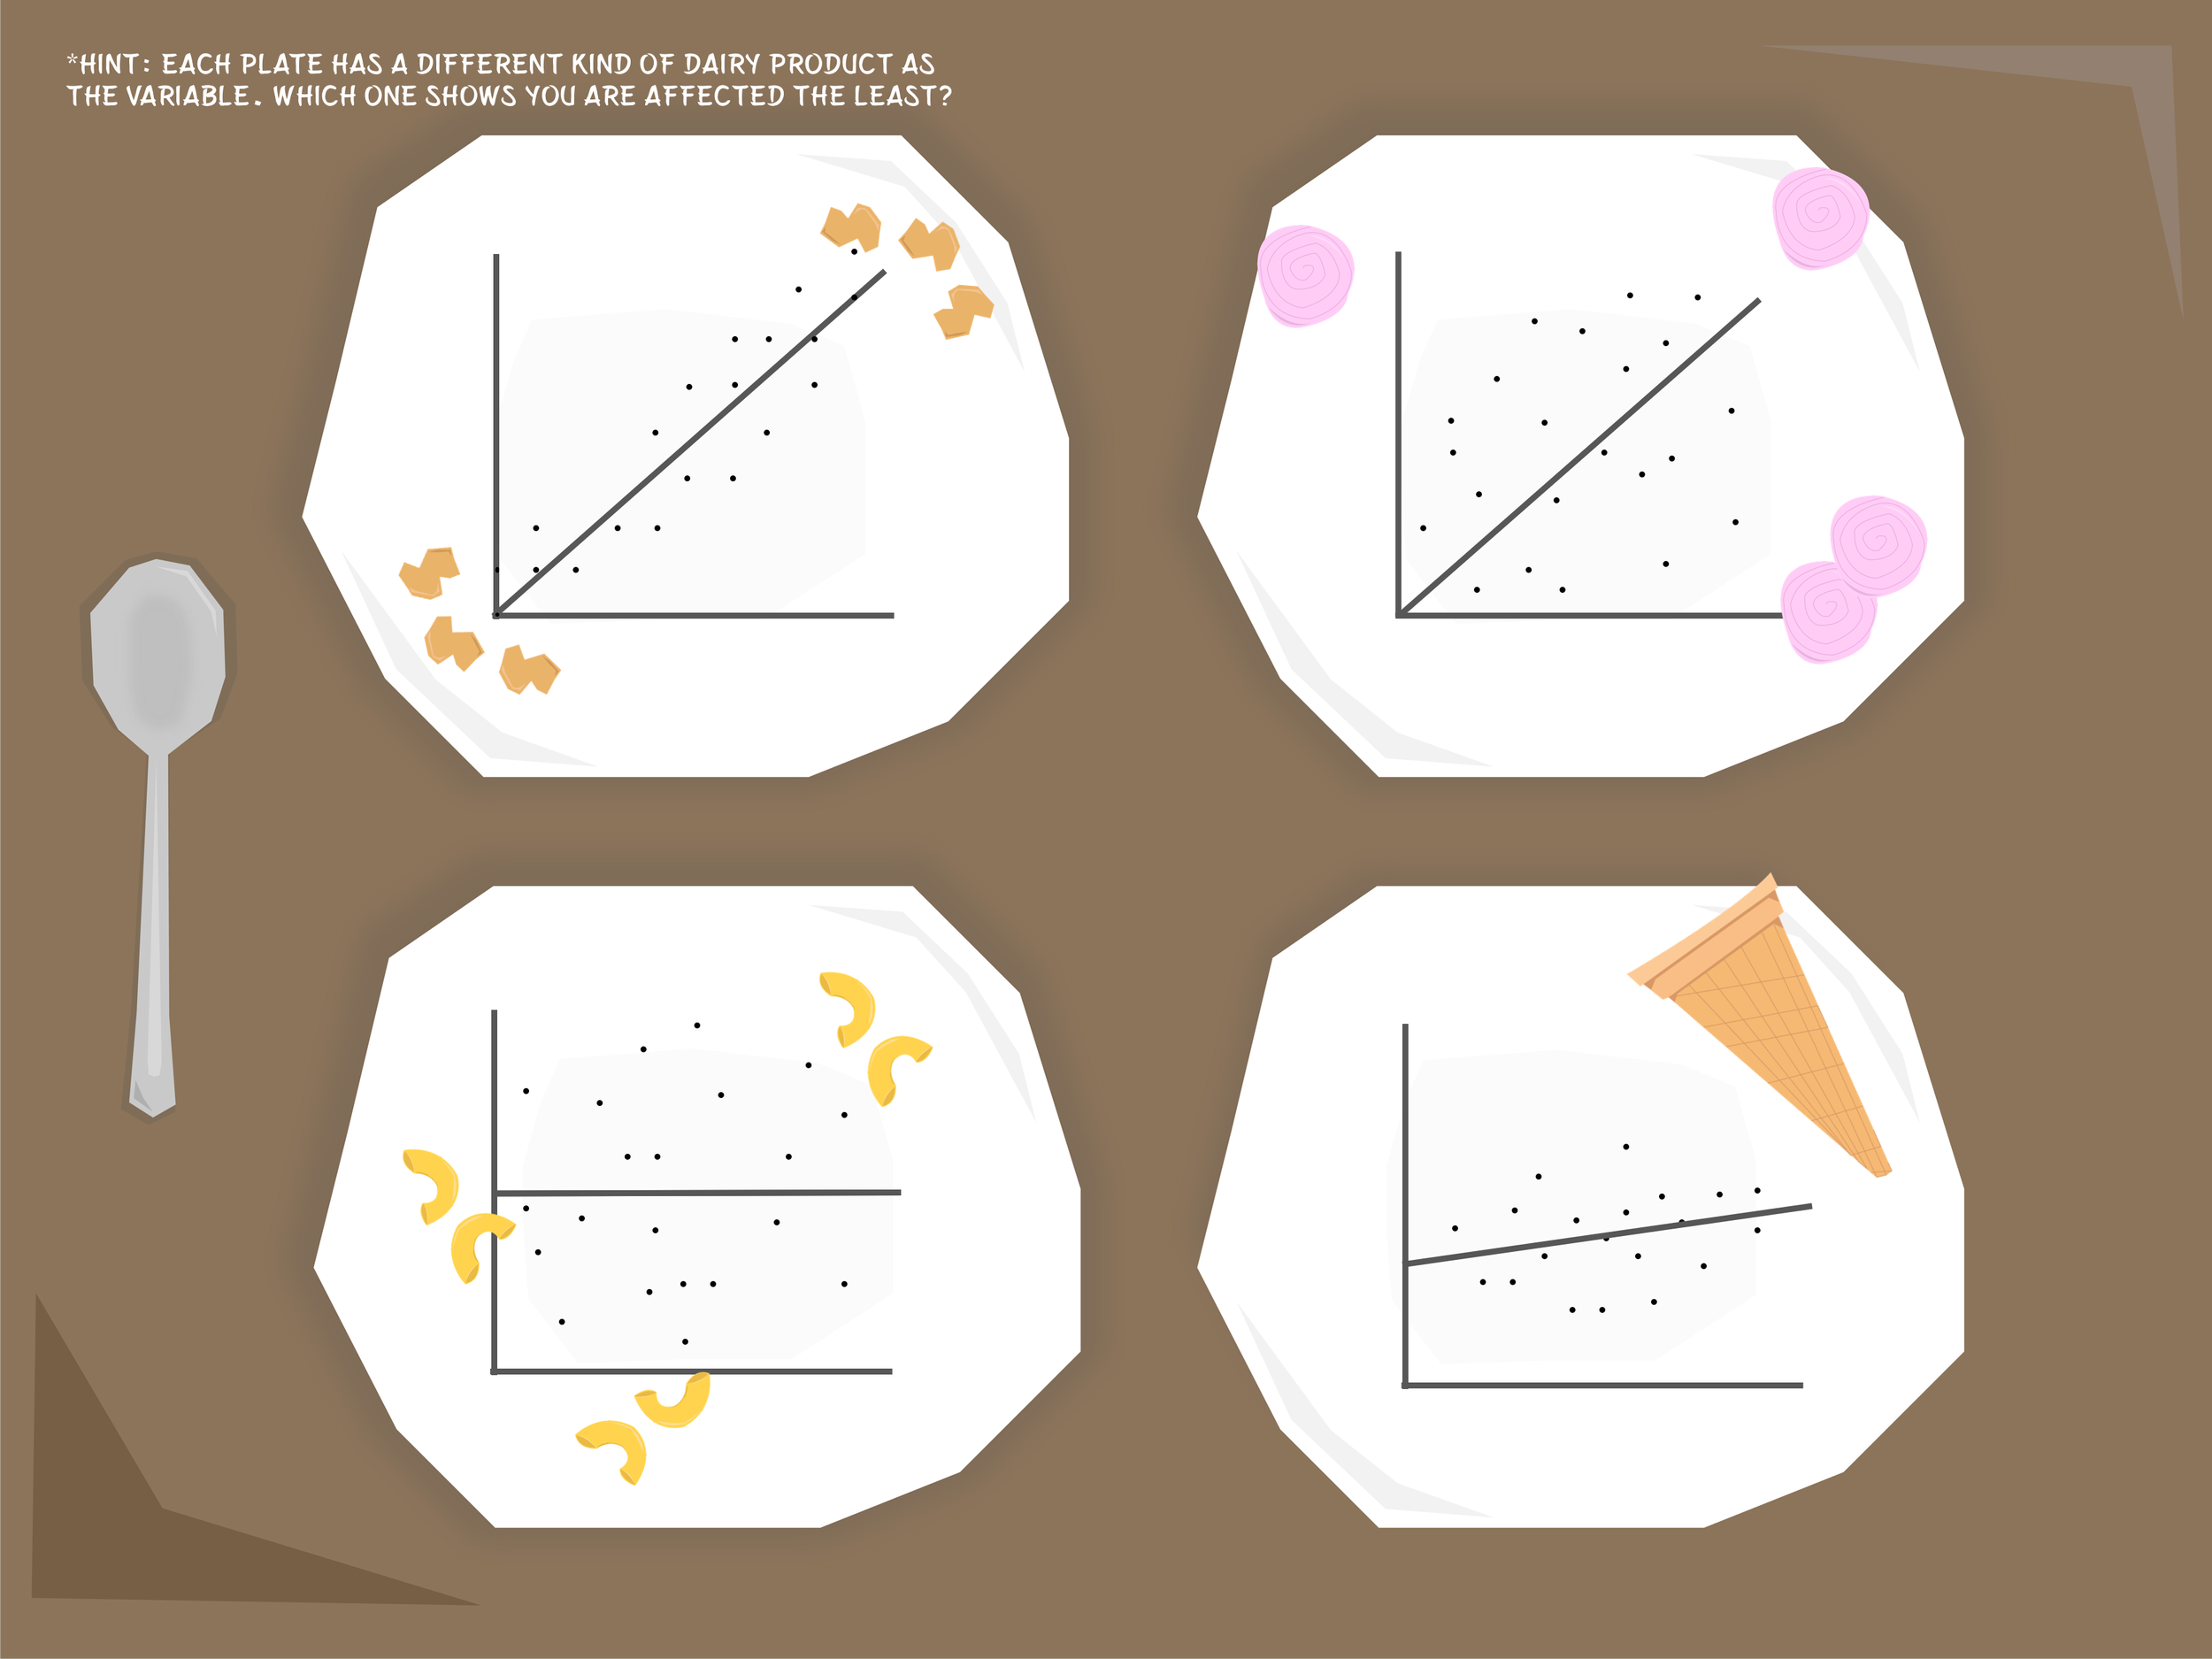
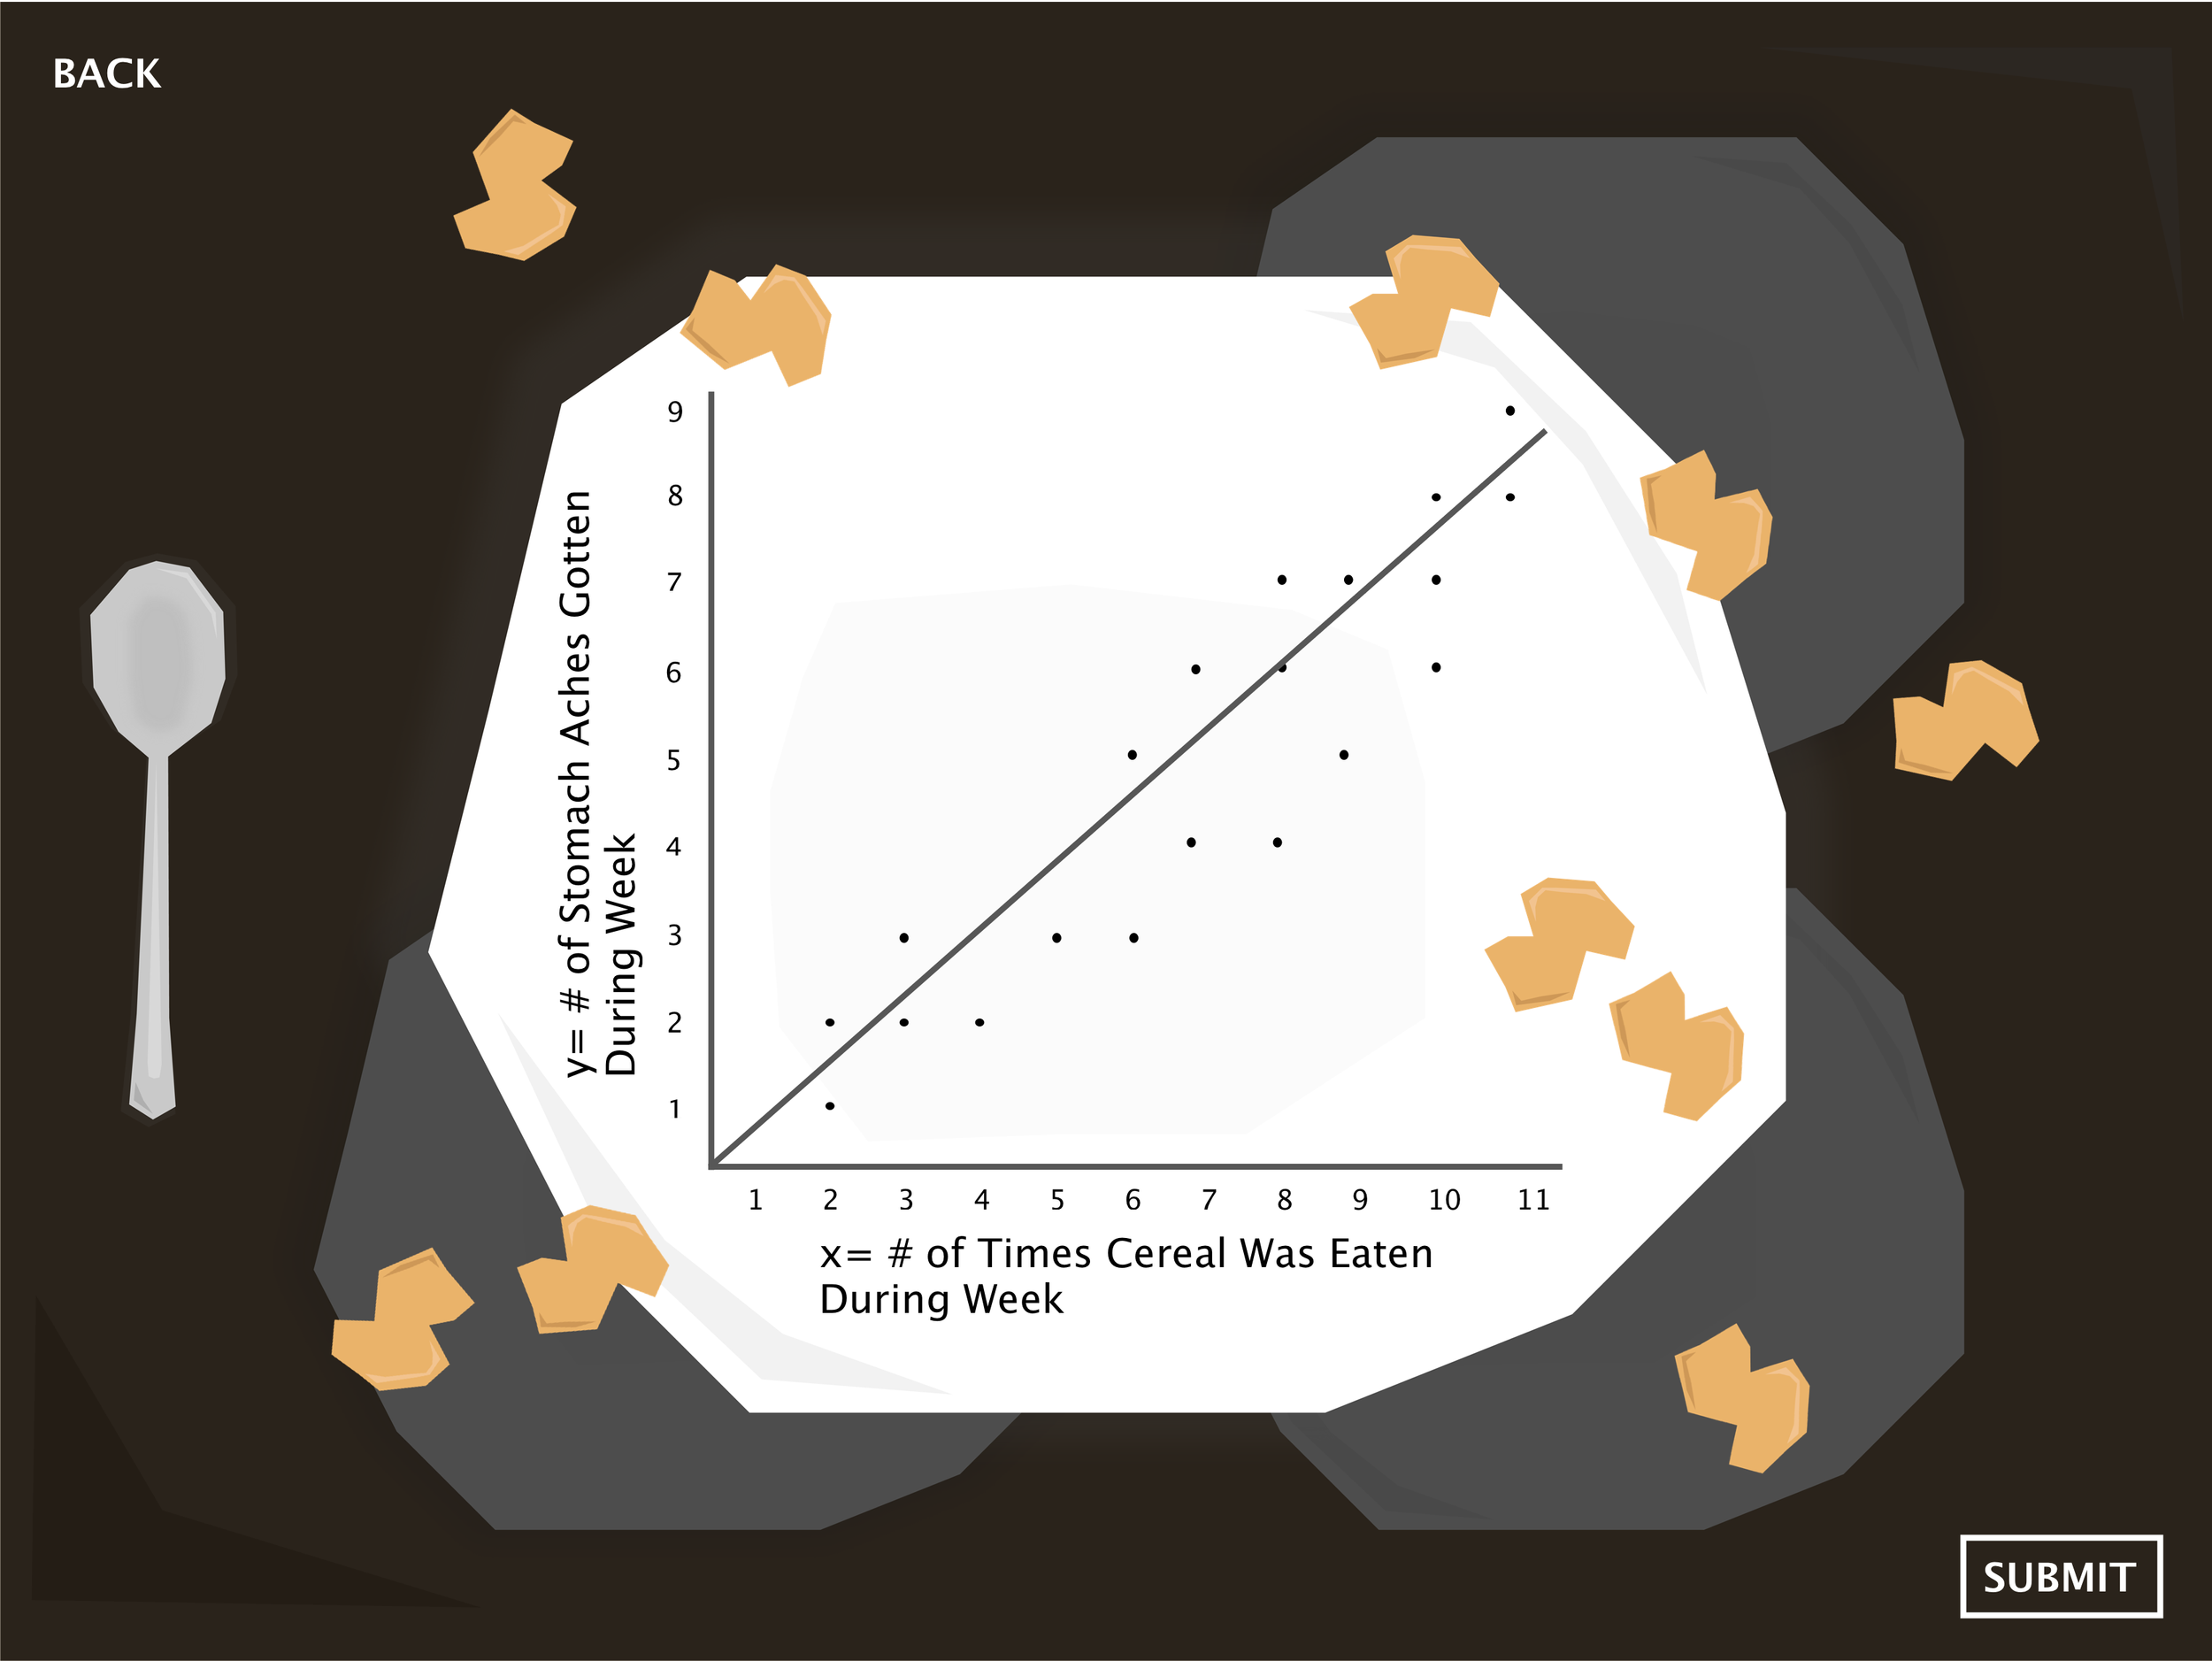
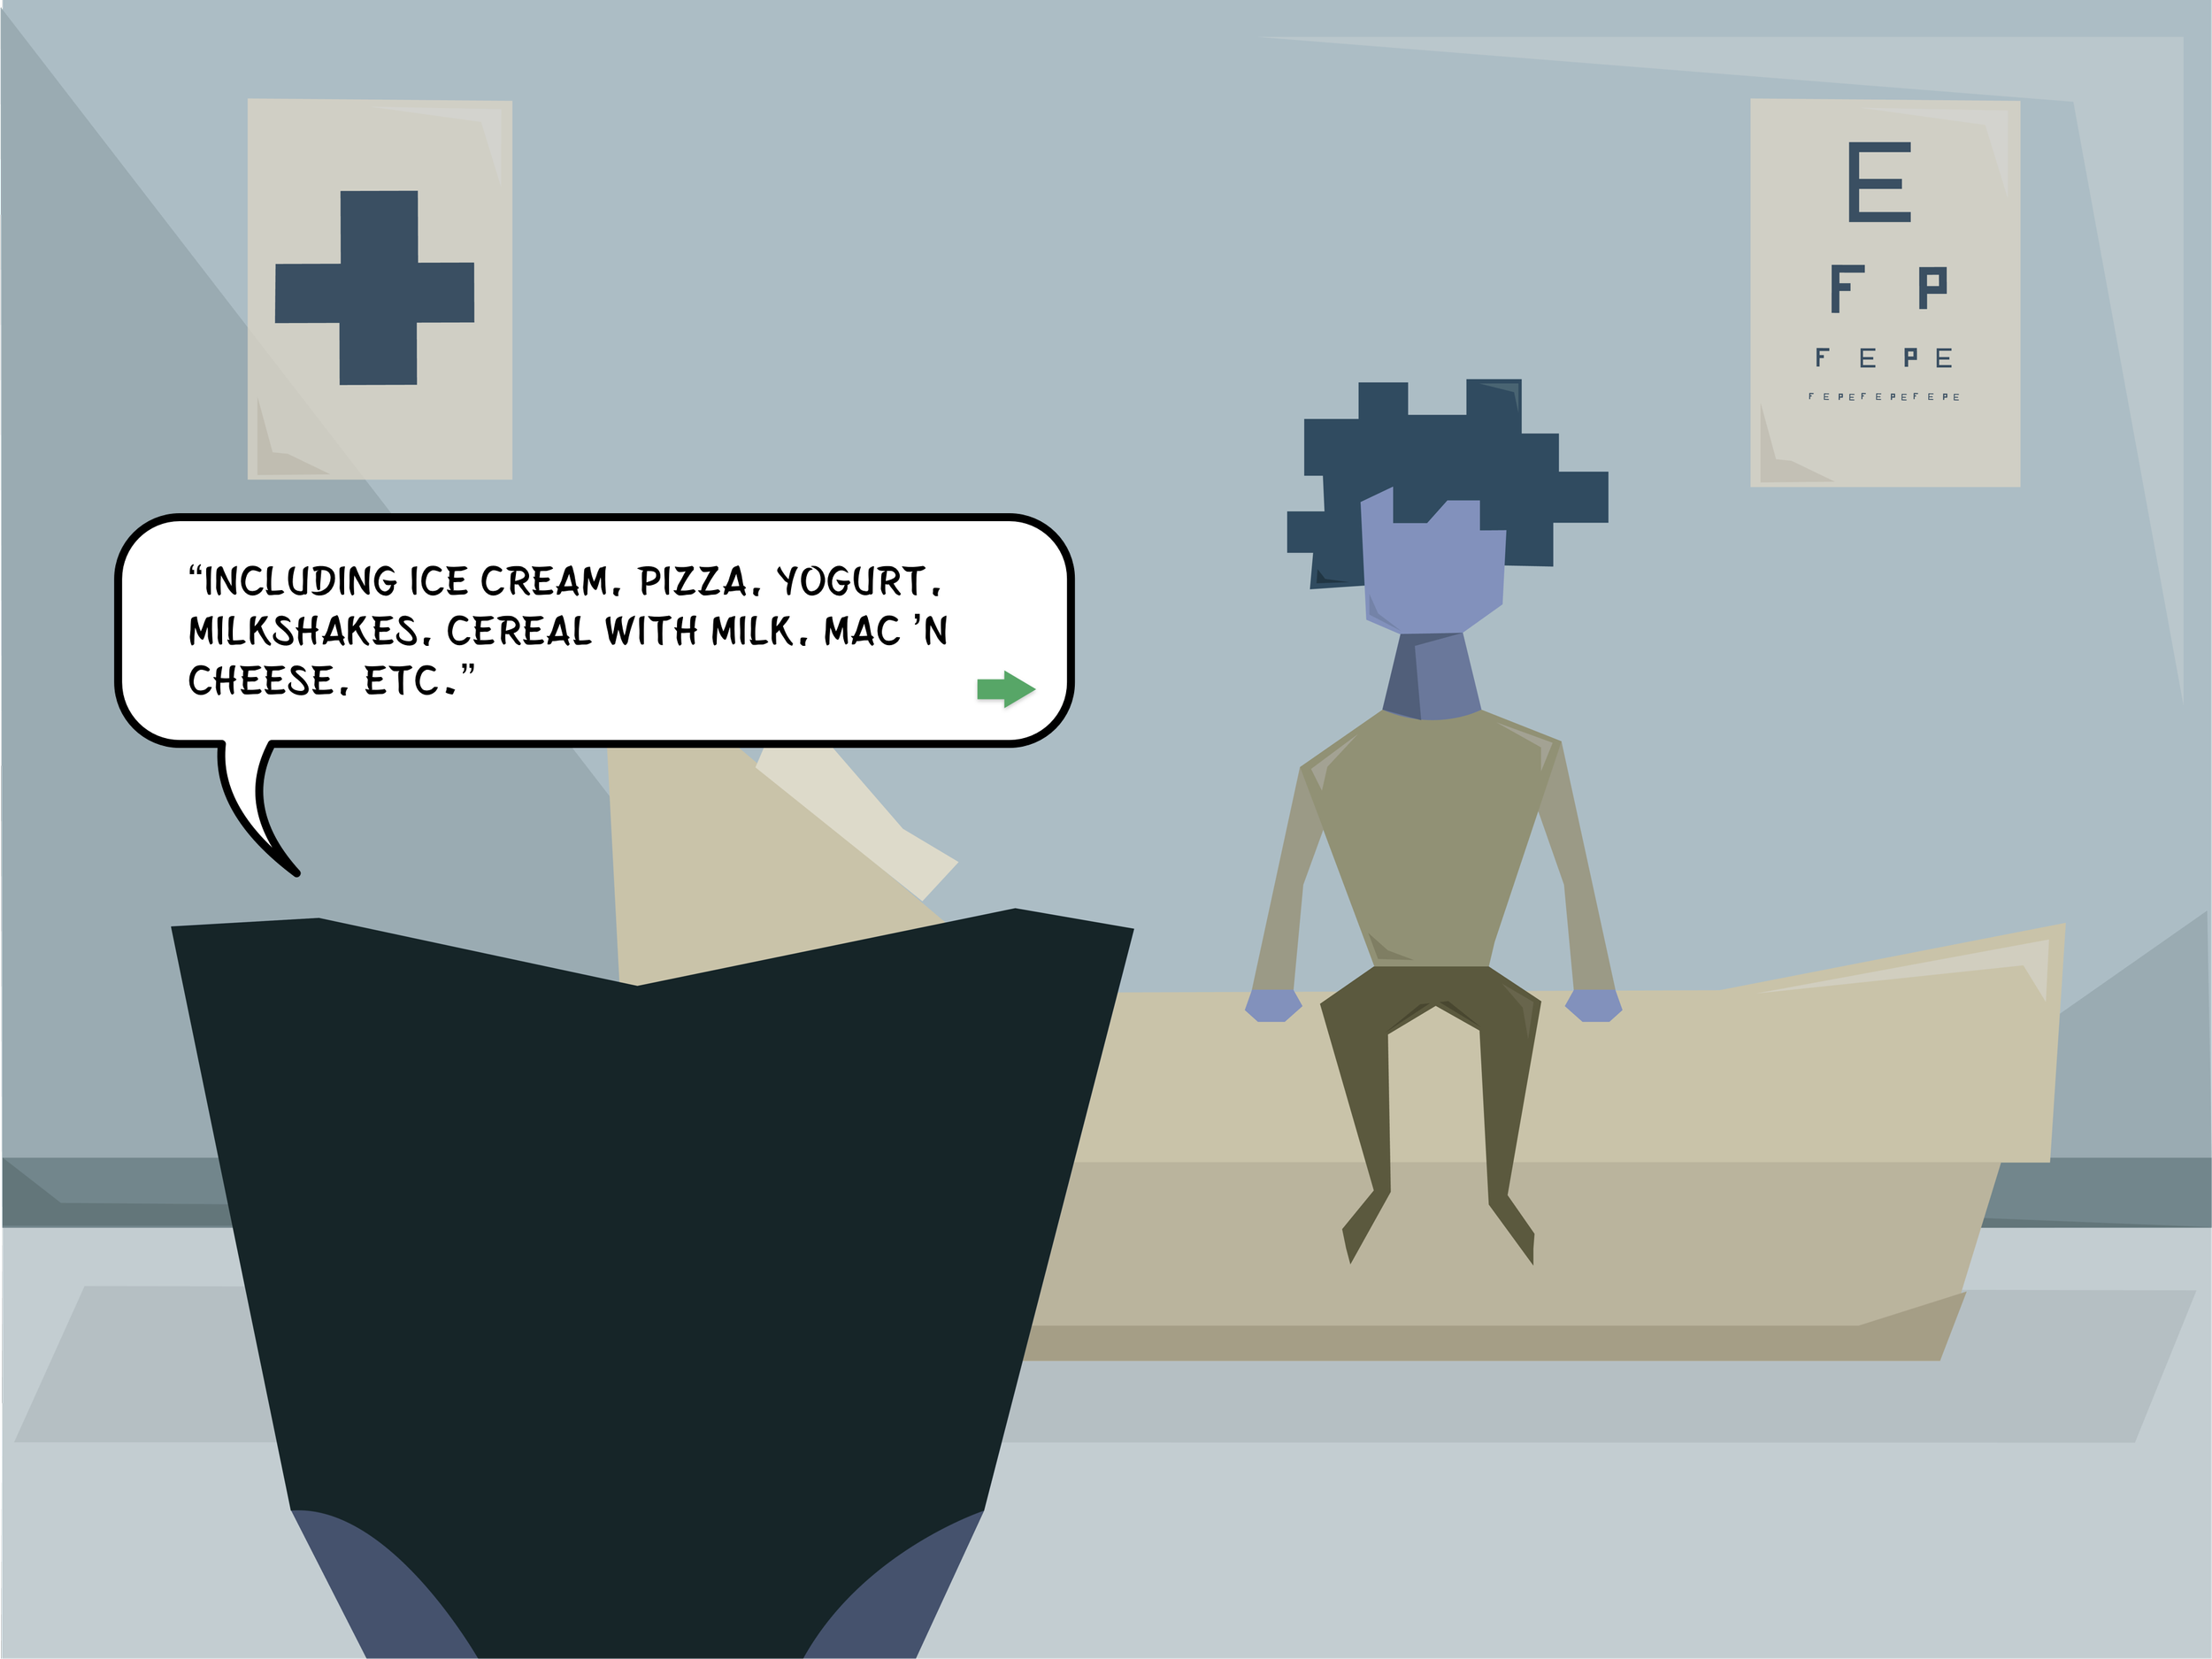
When designing our solution we focused on capturing the attention of middle schoolers who are easily distracted by giving them brief realistic situations to work through. We developed a narrative based game where users would be able to choose from a variety of different stories with different genres. Using the concepts they learn in the game, they must work through critical real life scenarios. The stories increasingly become more difficult as the user completes them. Our tool is designed to be used at home, however, teachers can use it in the classroom to help with their lesson.
Experience Design, Research, User Testing, Interaction Design, Branding, Prototyping, Collaboration
Project Launch
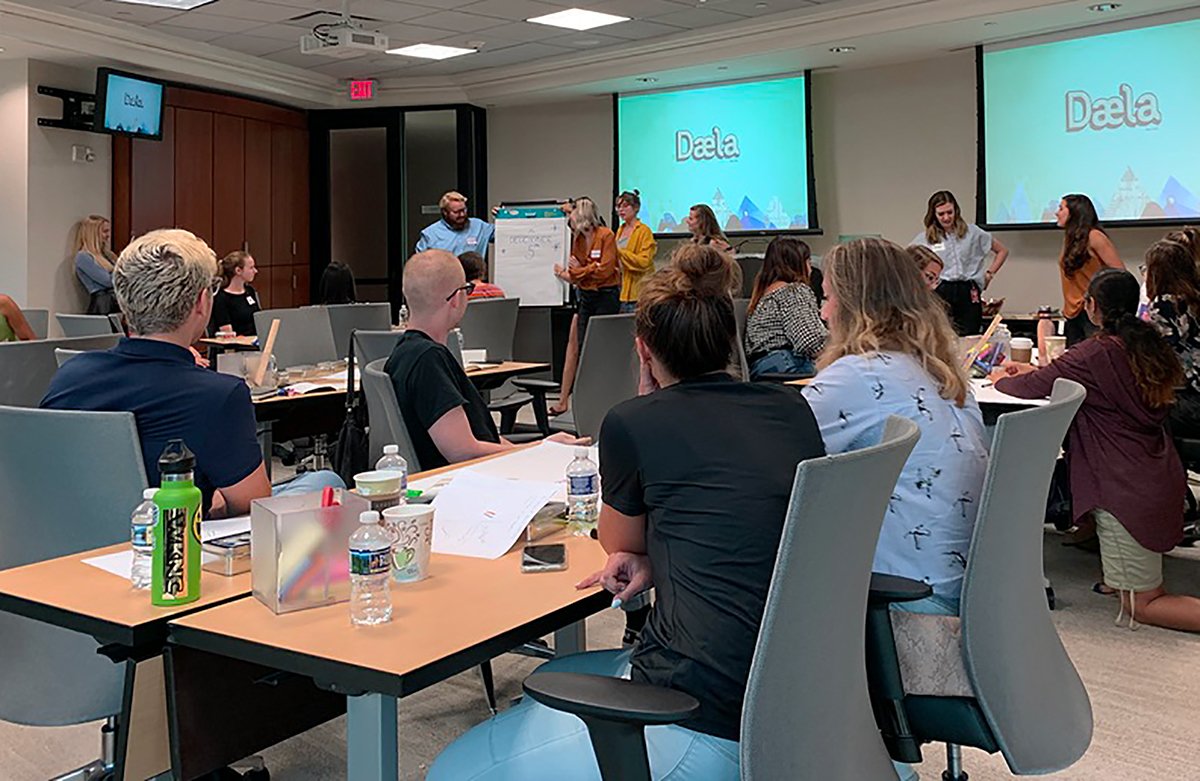
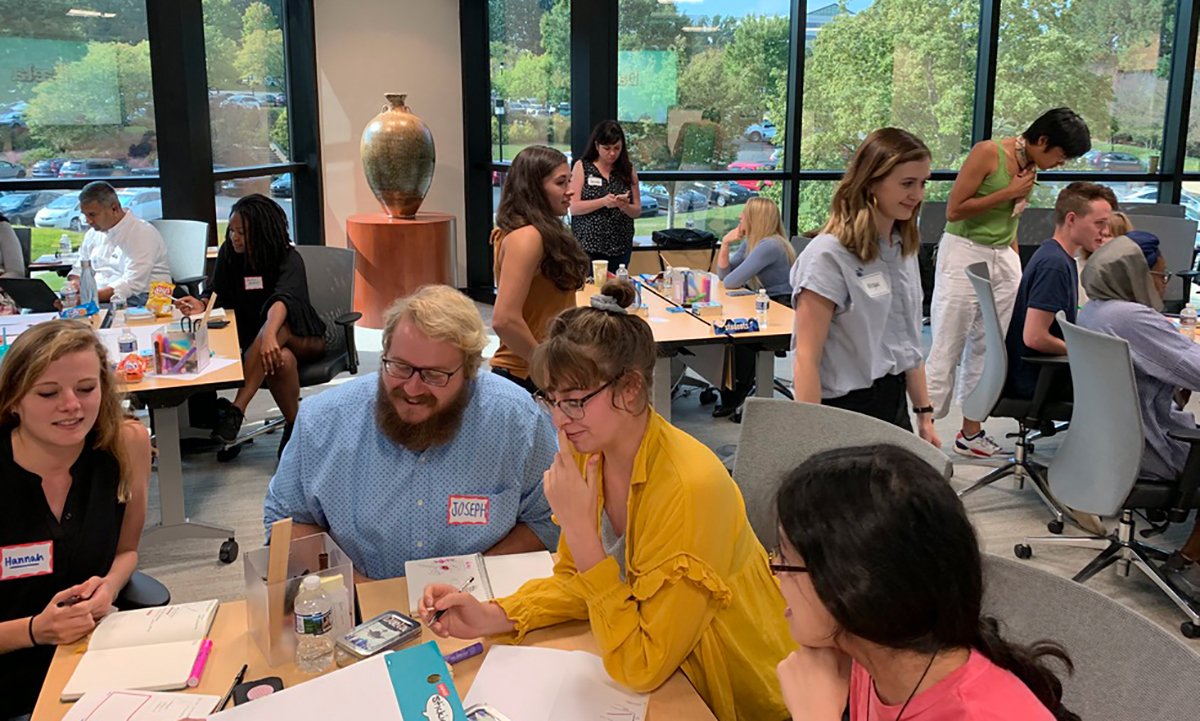
SAS invited our studio to their campus for the project launch where we learned about the company and their goals for the project. We completed design exercises to help us start thinking about data concepts and how we can use this opportunity to step away from the traditional methods of teaching and relate the content to the real world. We were divided into teams of four and assigned a math concept to focus on. My group was given the topic of correlation. Our goal was to create a fun and interactive tool that middle schoolers can use for additional support outside of school.
Research & Benchmarking Findings
Our next step was to gather insight about how middle schoolers best learn and what they struggle with. For this project we were focusing on at-risk kids with learning barriers. We analyzed existing data literacy tools that effectively engage users in learning a concept. We found that successful tools provide immediate feedback allow users to share progress, use storytelling, have simple designs, give positive reinforcement, and simulate real life situations.


Interviews
We conducted numerous interviews with middle school students and teachers to discover more about the middle school learning experience. We inquired what they enjoy learning about, what they have trouble with while learning, how they like to work, what devices they use while working, as well as, what gets them excited about the material they are taught.

Persona & Scenario
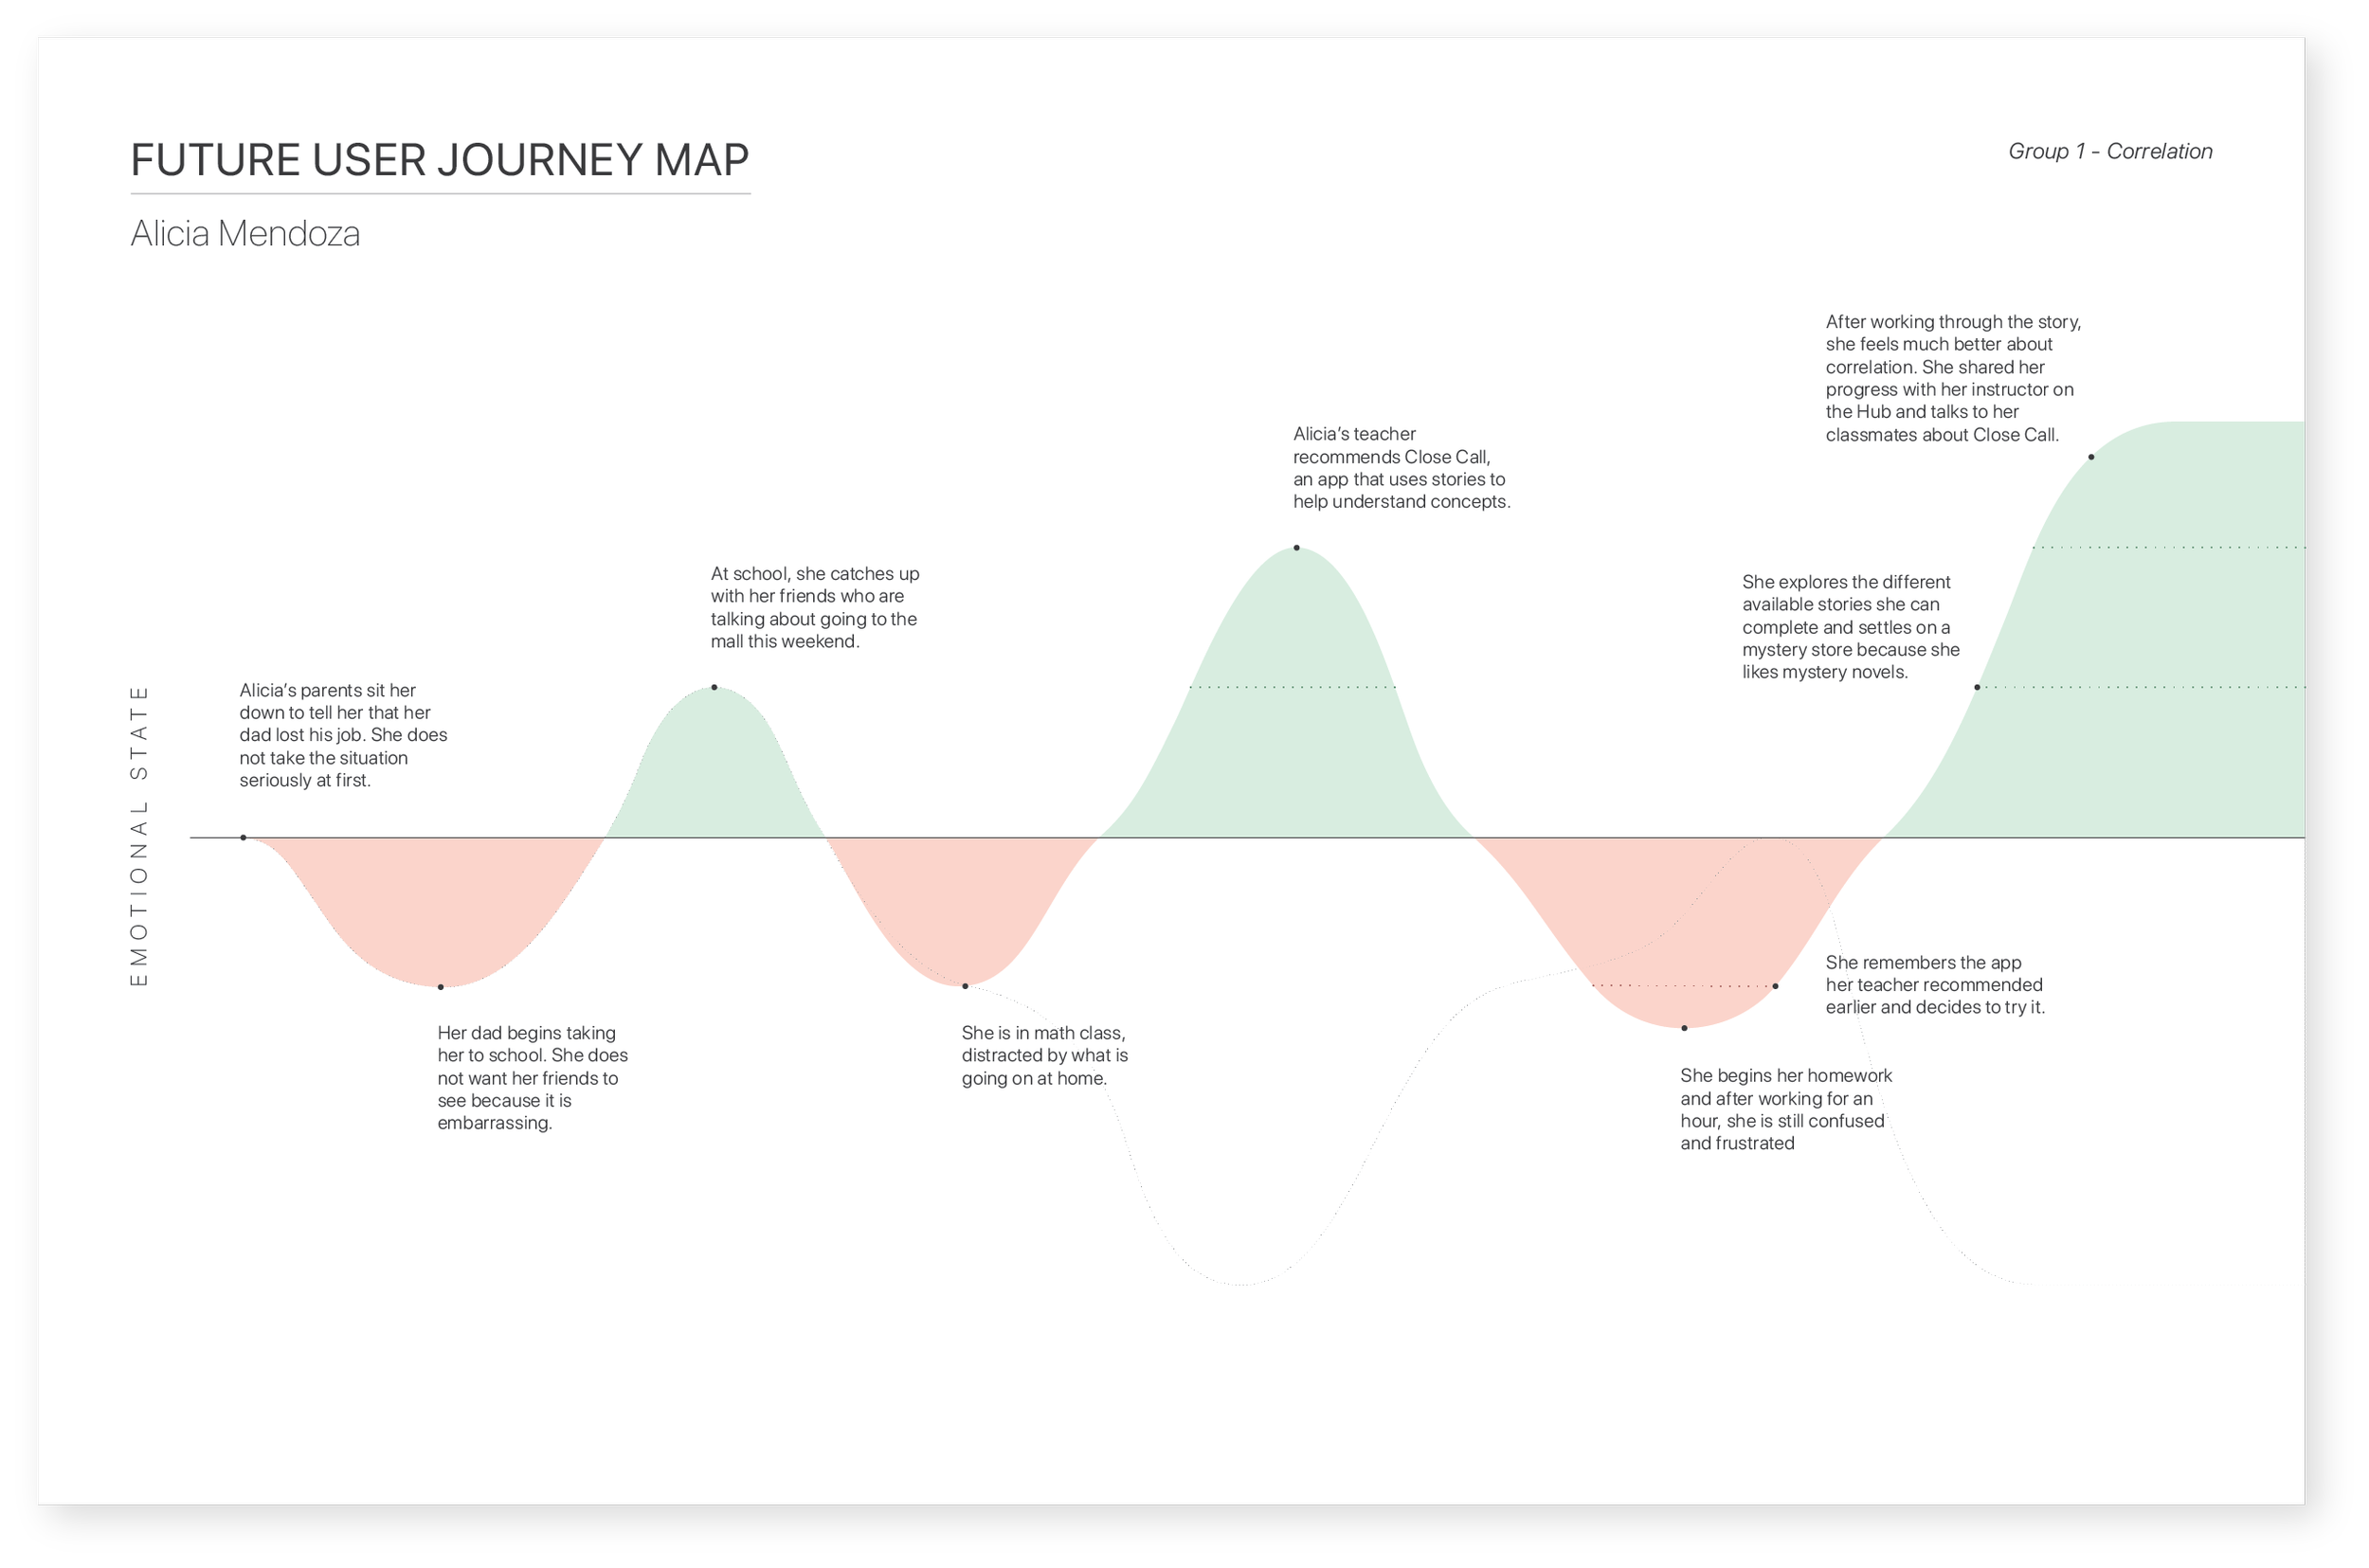
Based on our interviews and research, we built a persona of a middle school student that included at least one barrier to learning with which this student struggles with. We found that students' experience outside of the classroom greatly influences their ability to learn and attention span. Our persona, Alicia, a 12 year old Latina student, is having trouble focusing in school because she is going through a lifestyle change with her dad getting laid off.

User Journey
We mapped Alicia's current learning experience, showing her emotional state throughout the day, highlighting the moments she struggles the most. From there, we were able to see what parts of her learning experience our tool would be able to improve. The future journey map shows Alicia gaining confidence in math concepts as a result of having extra practice outside of school.

Process
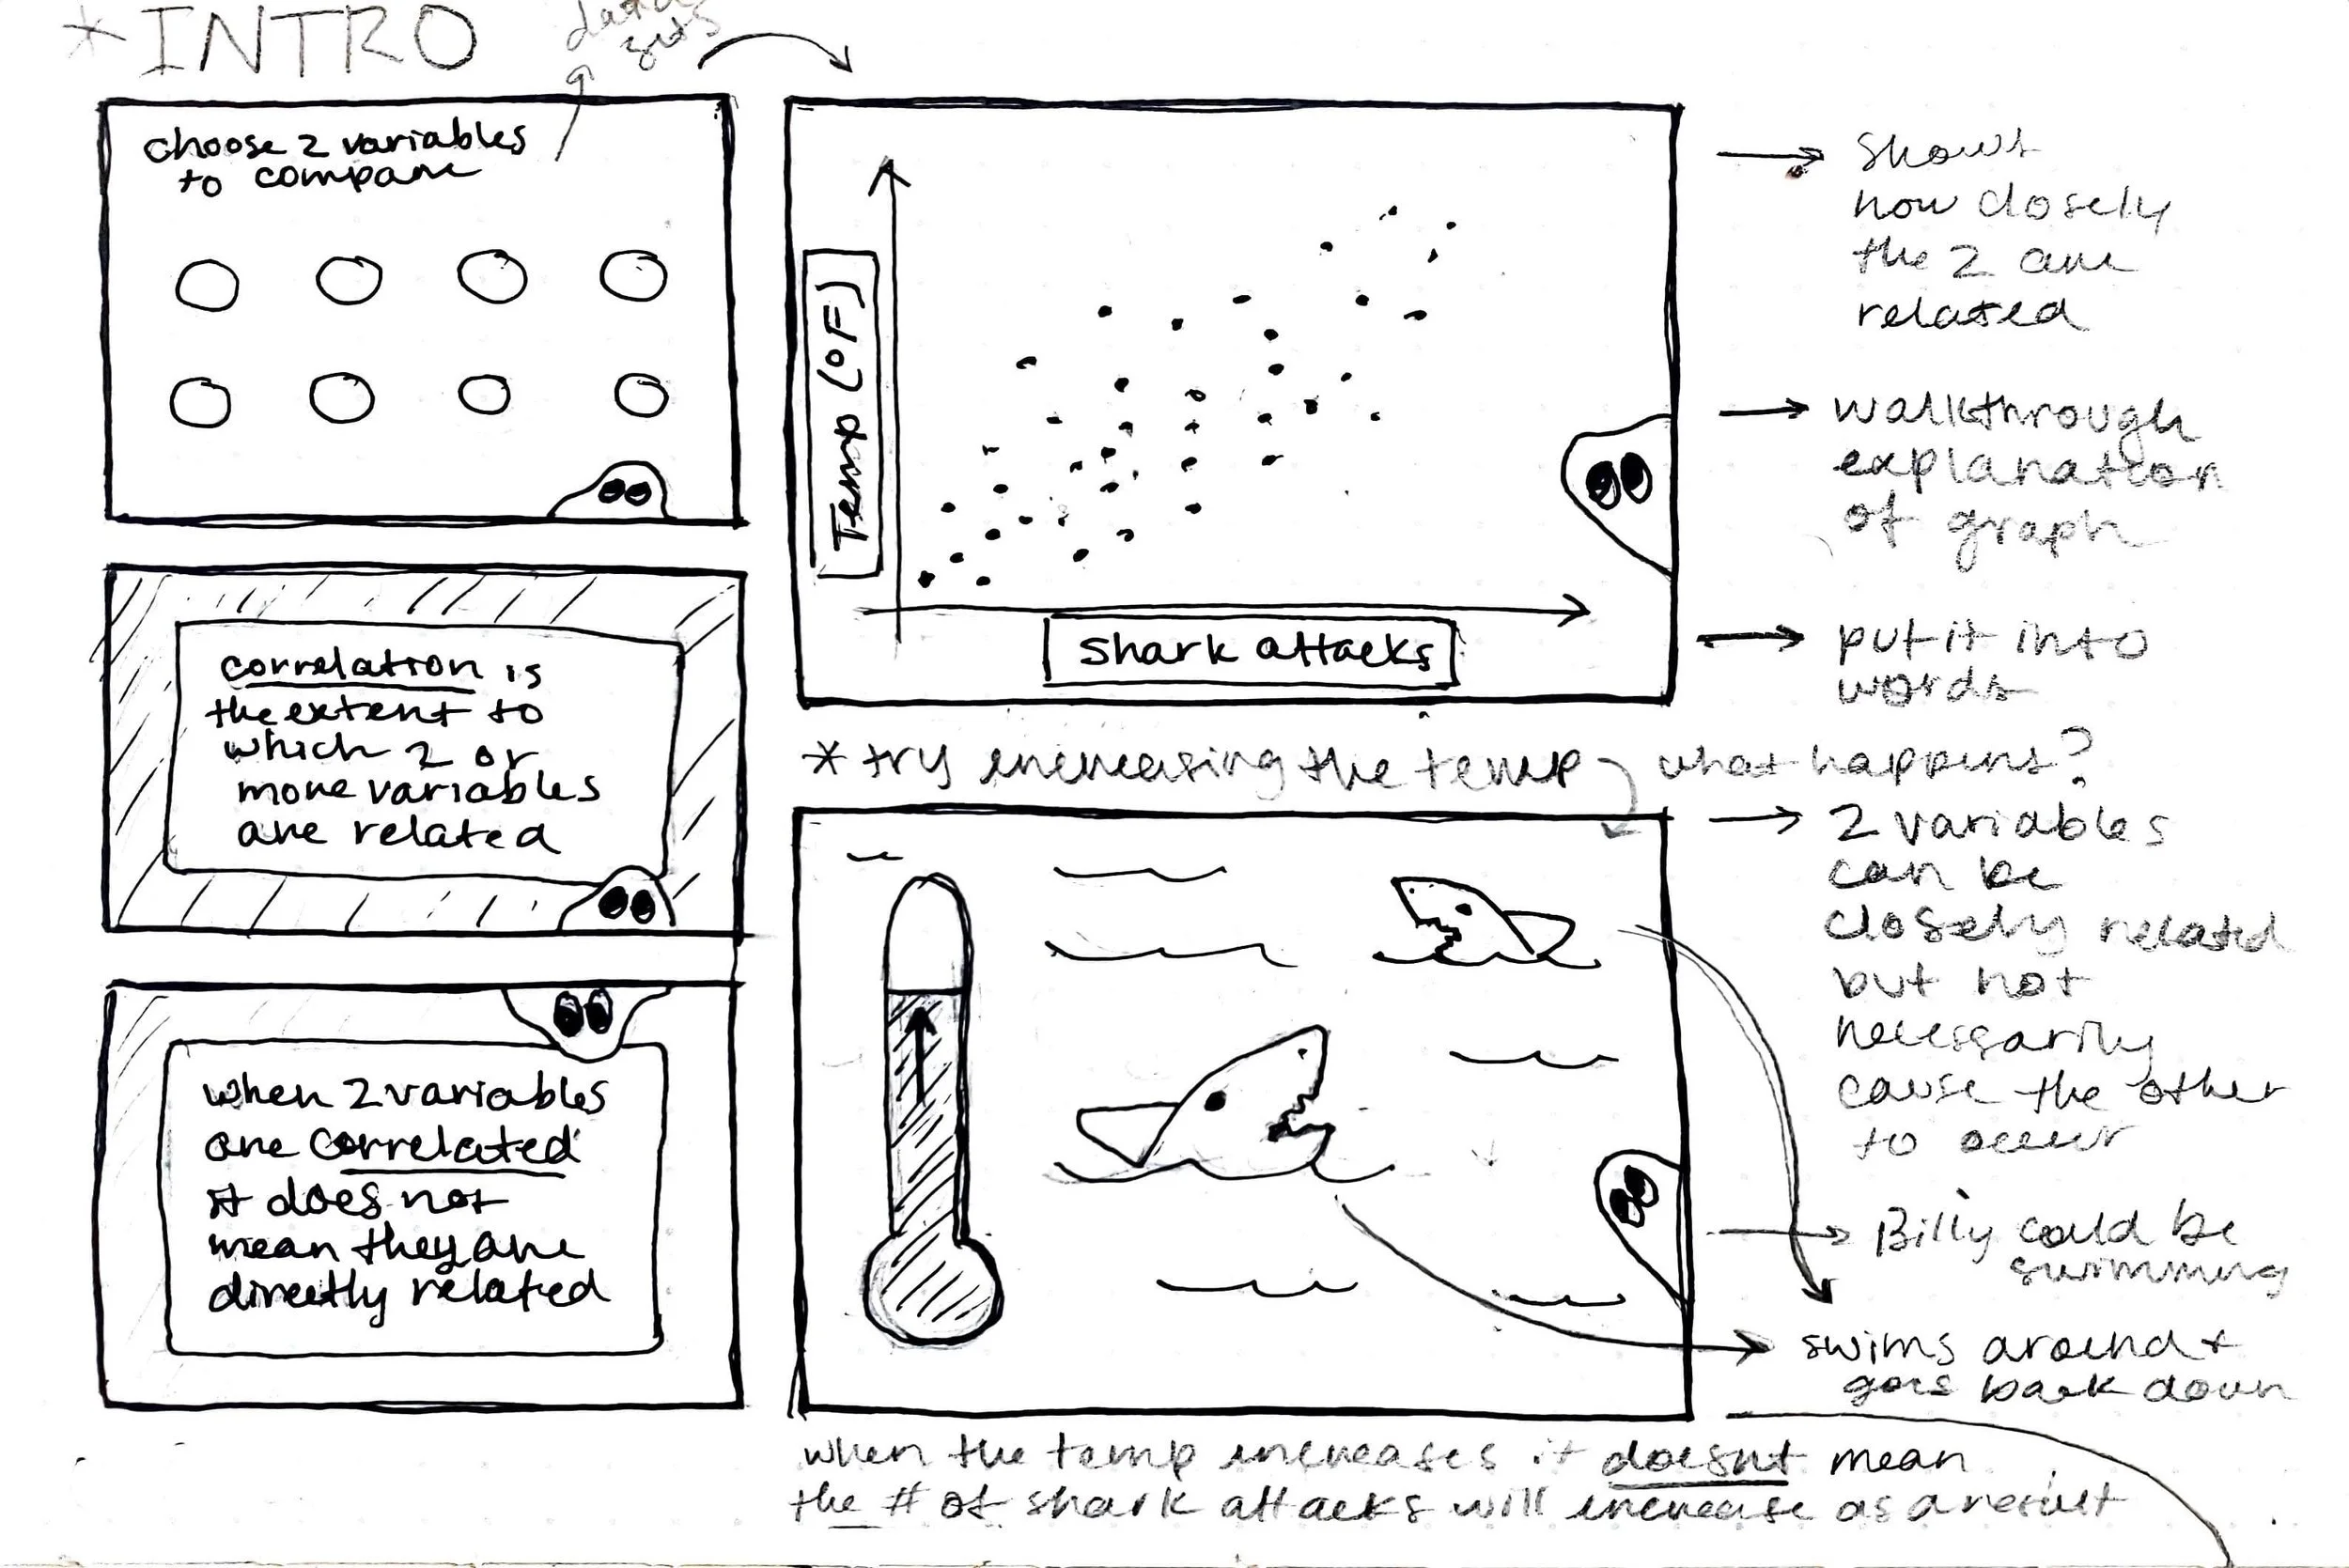
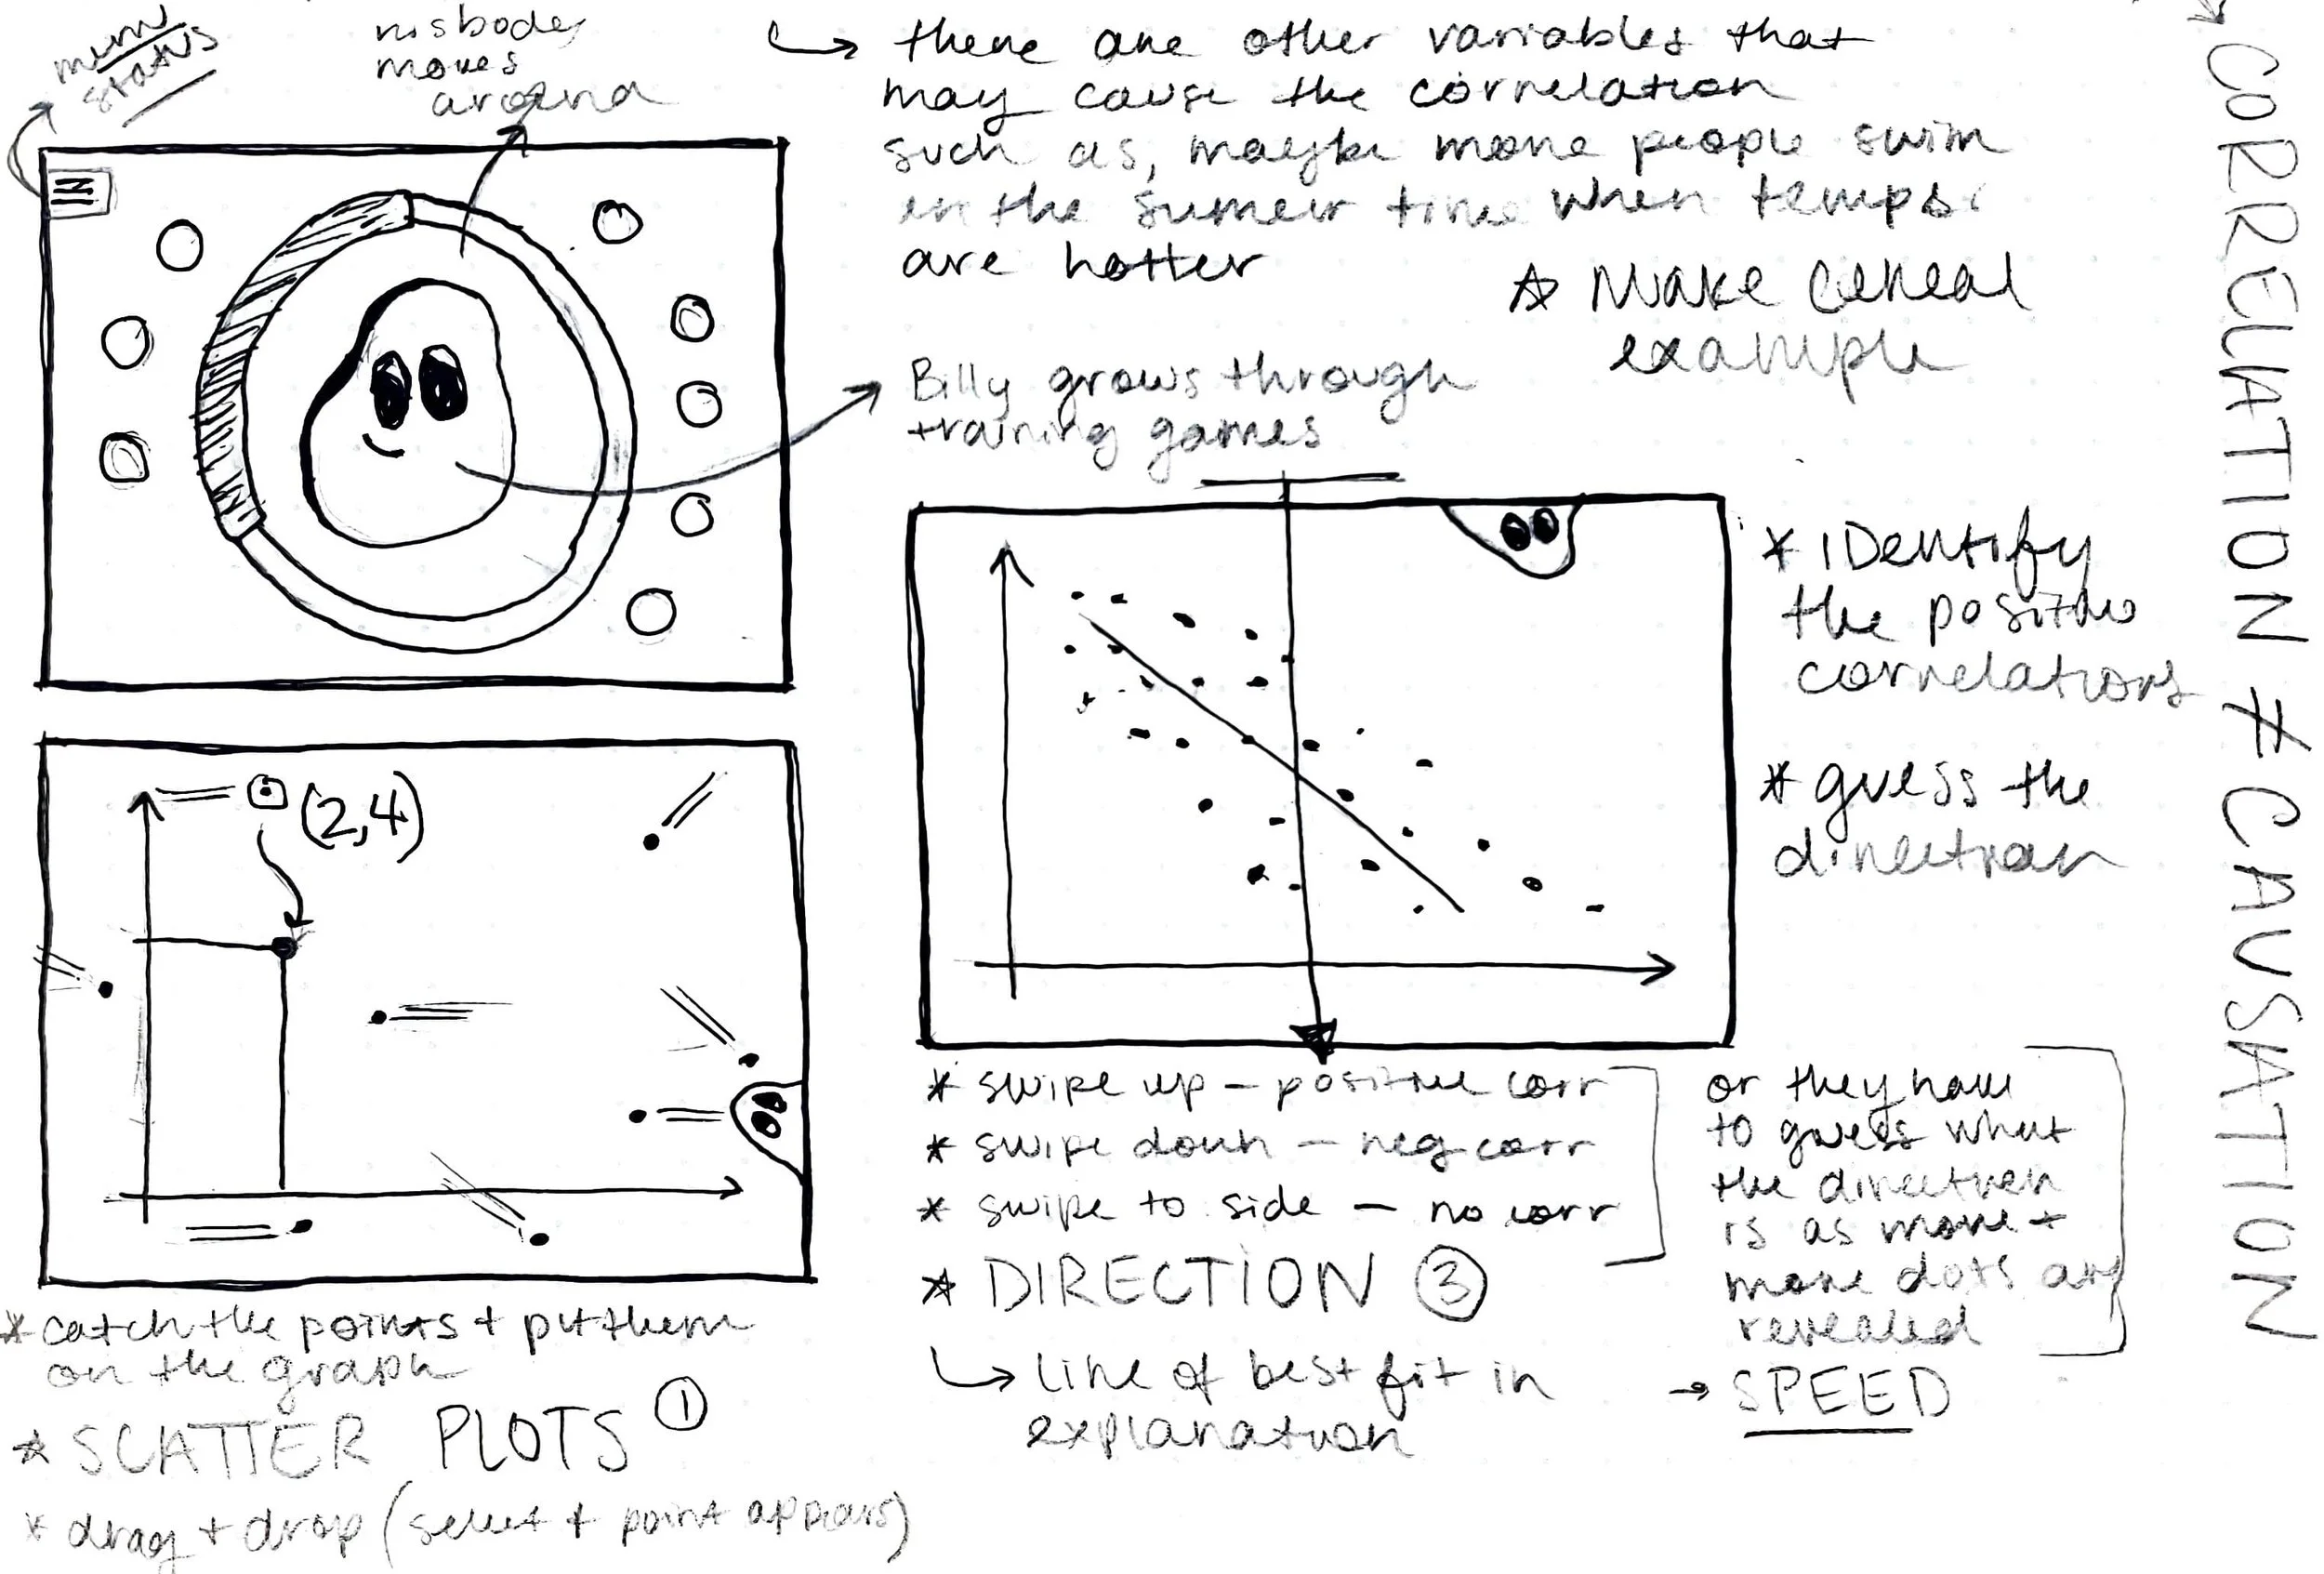
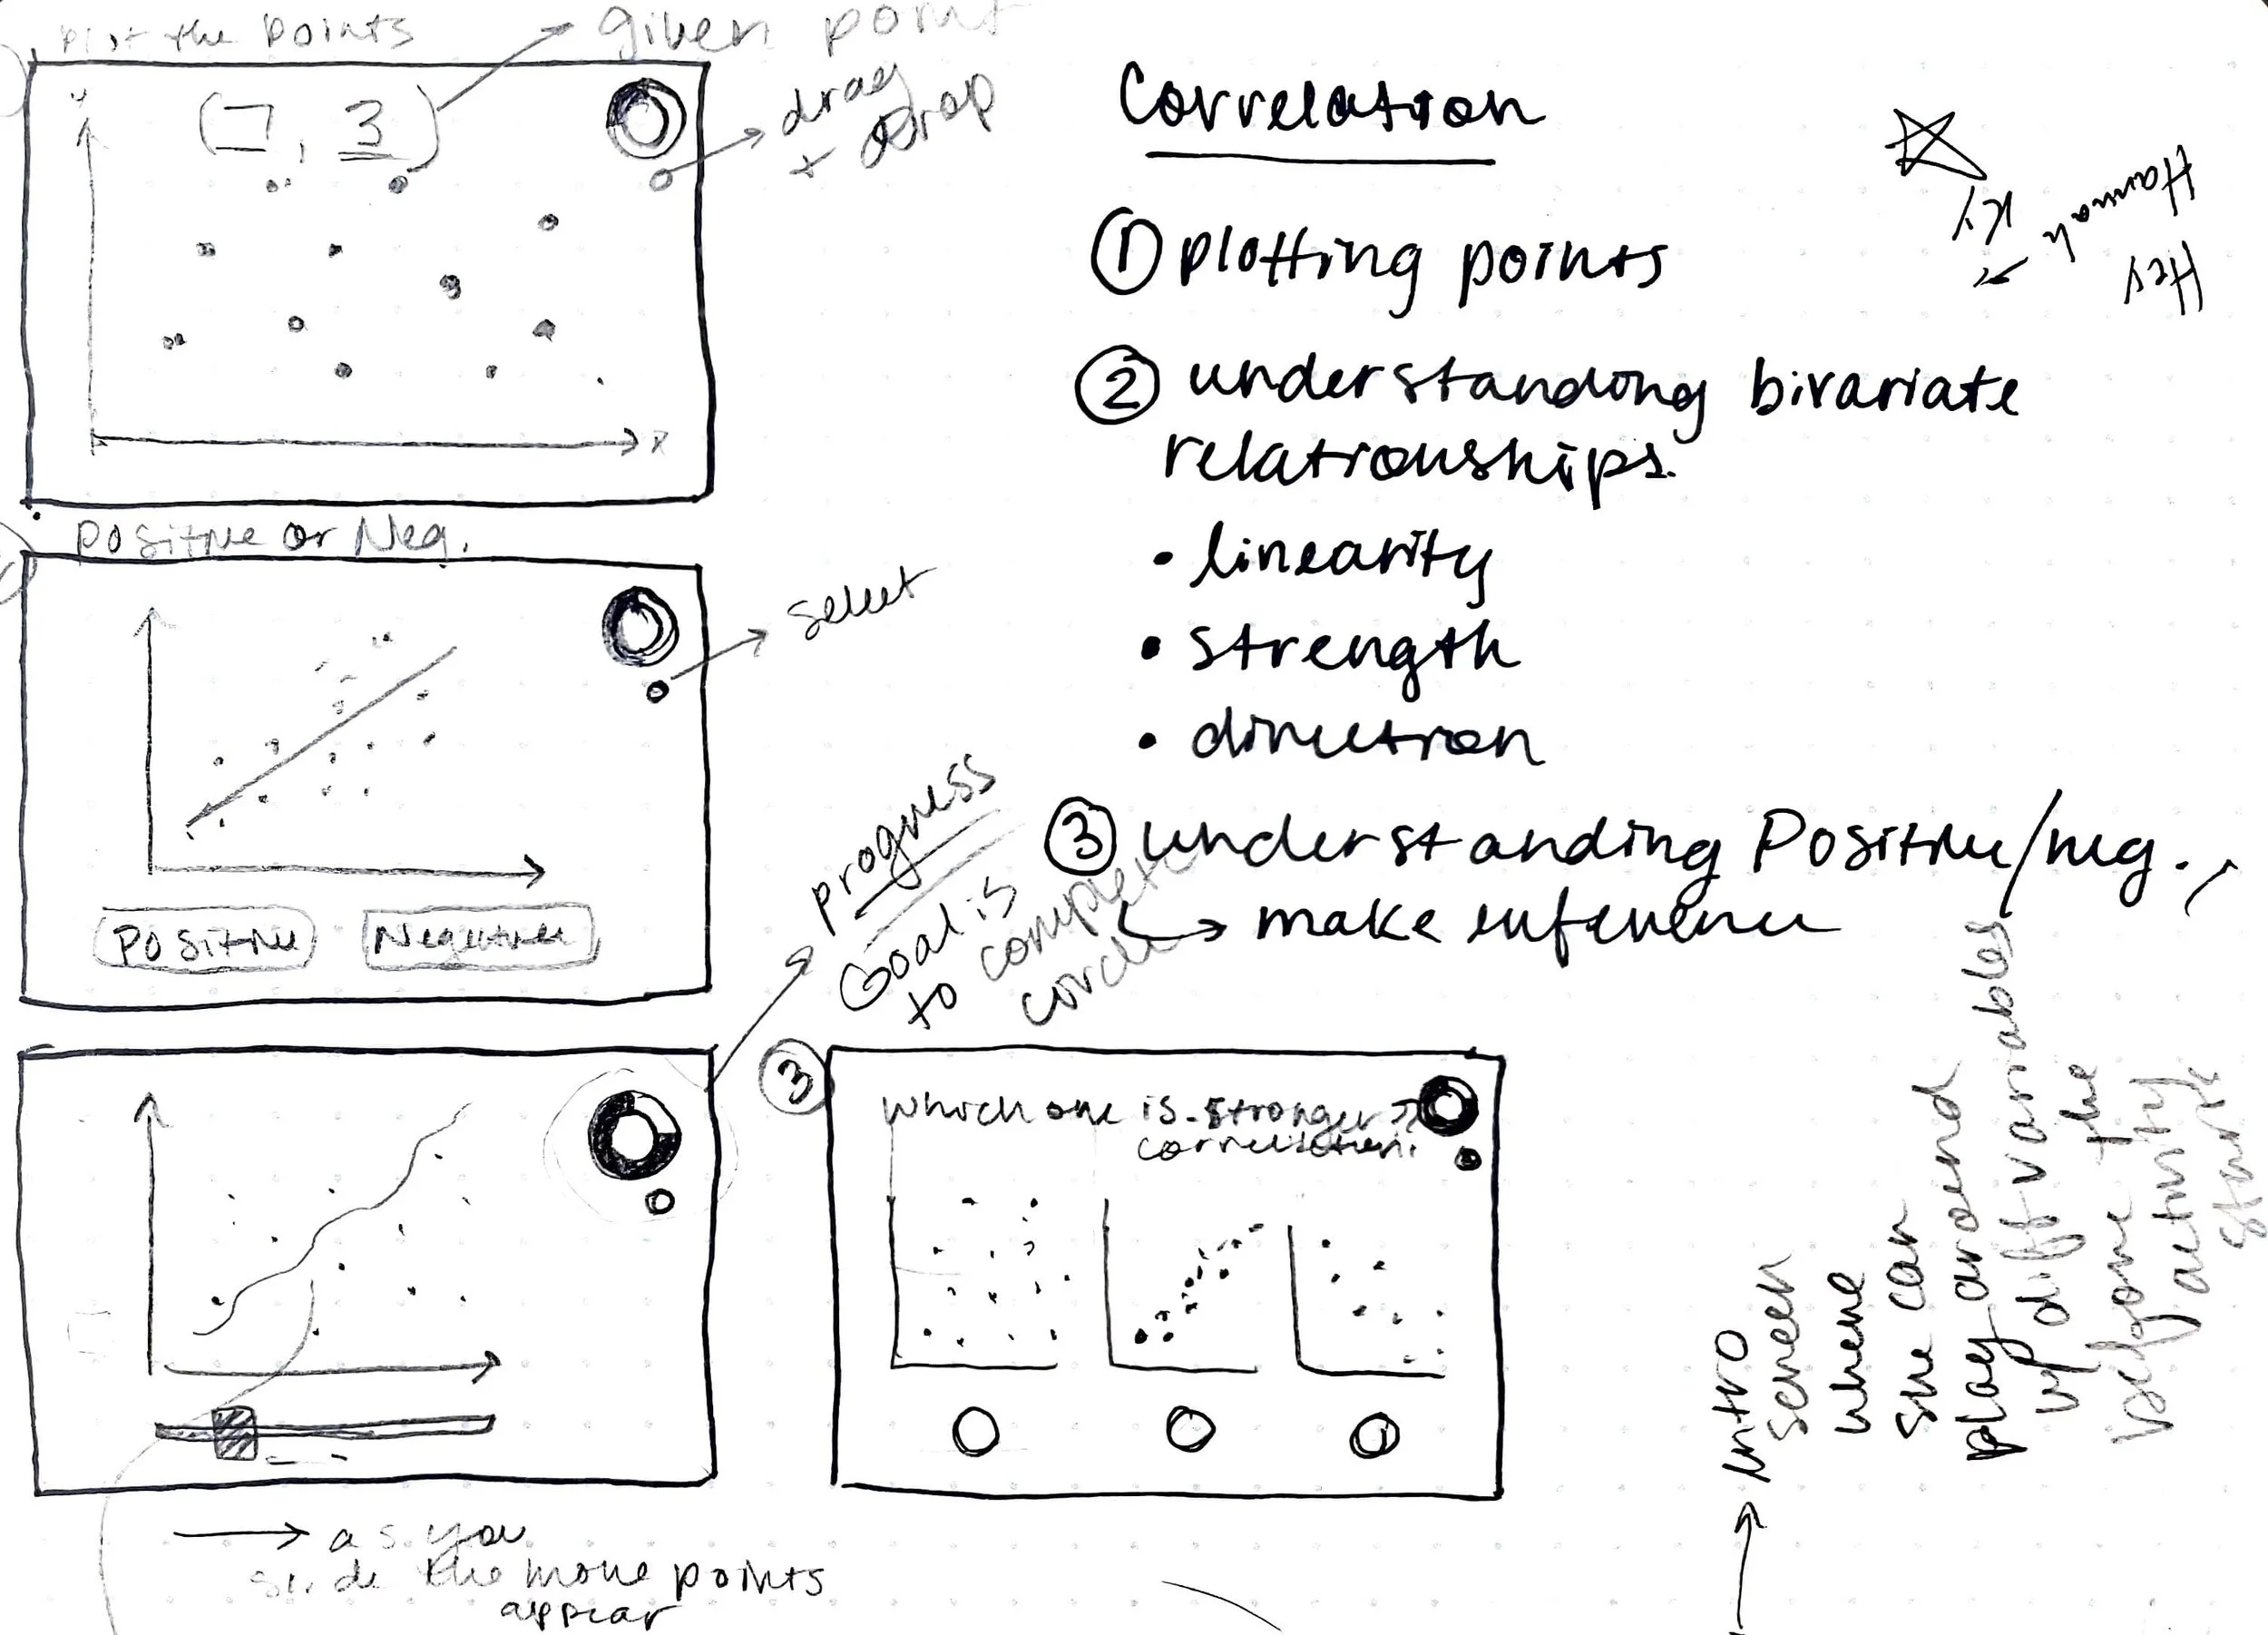
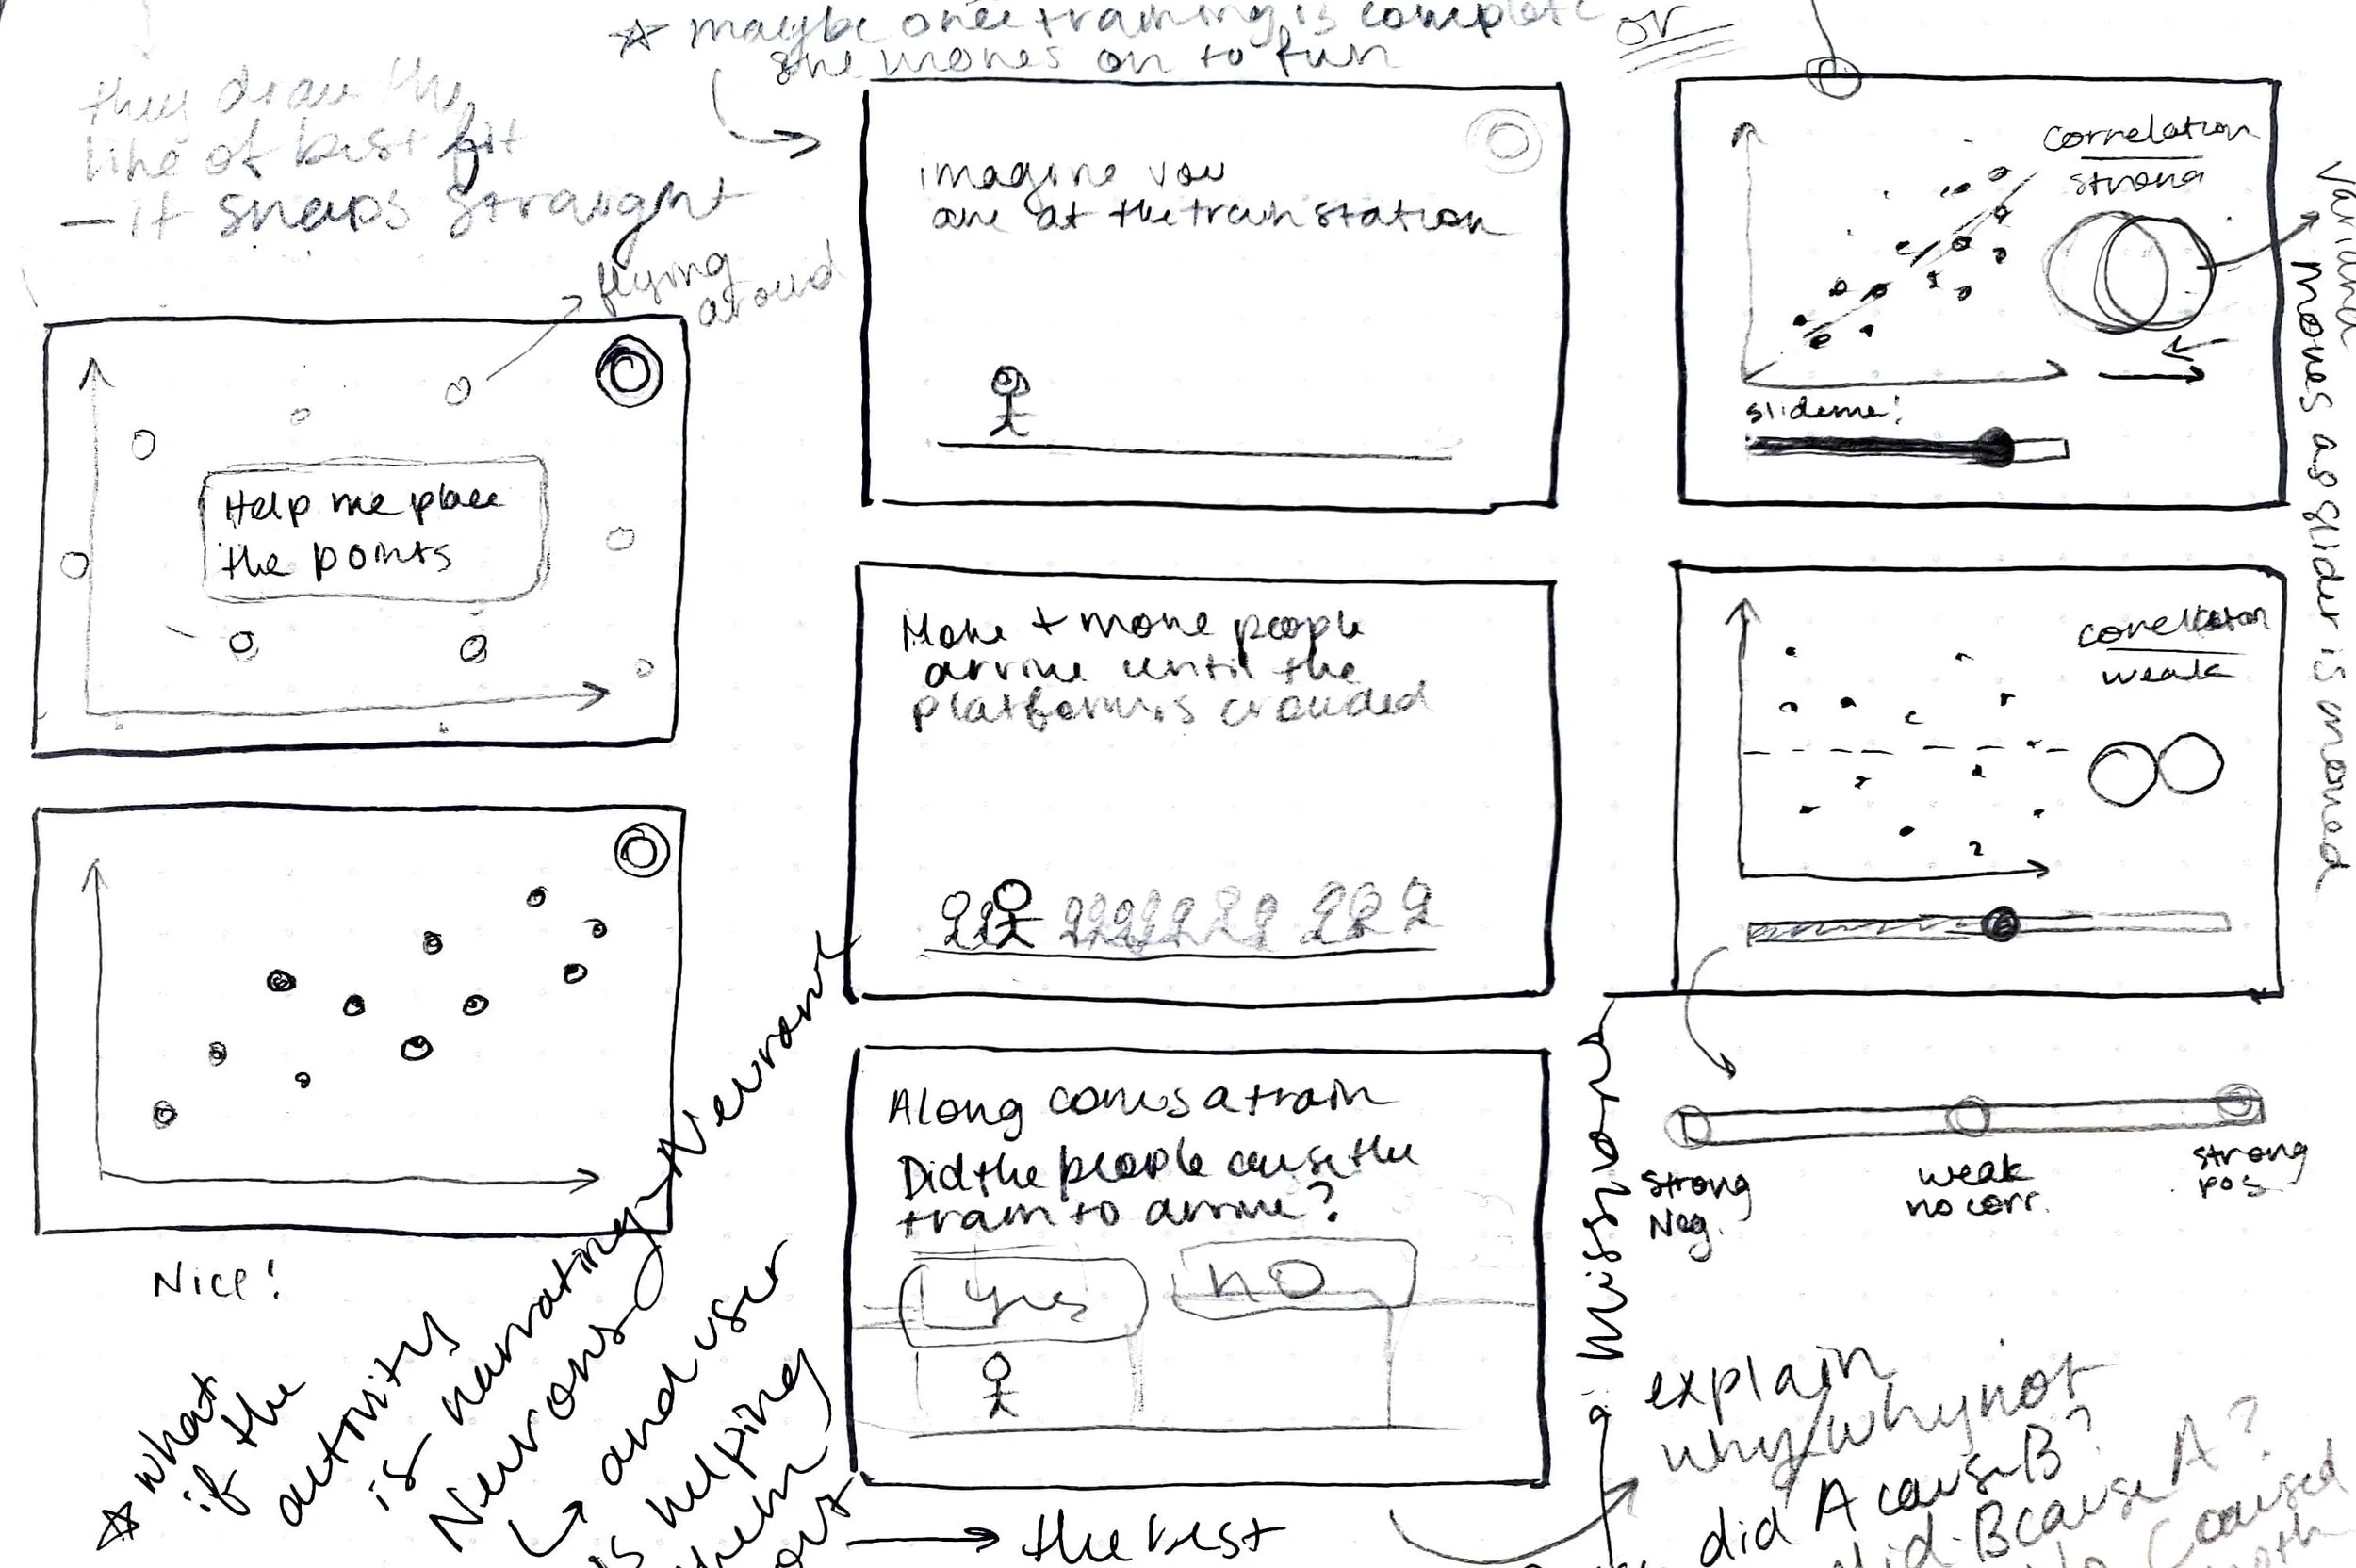
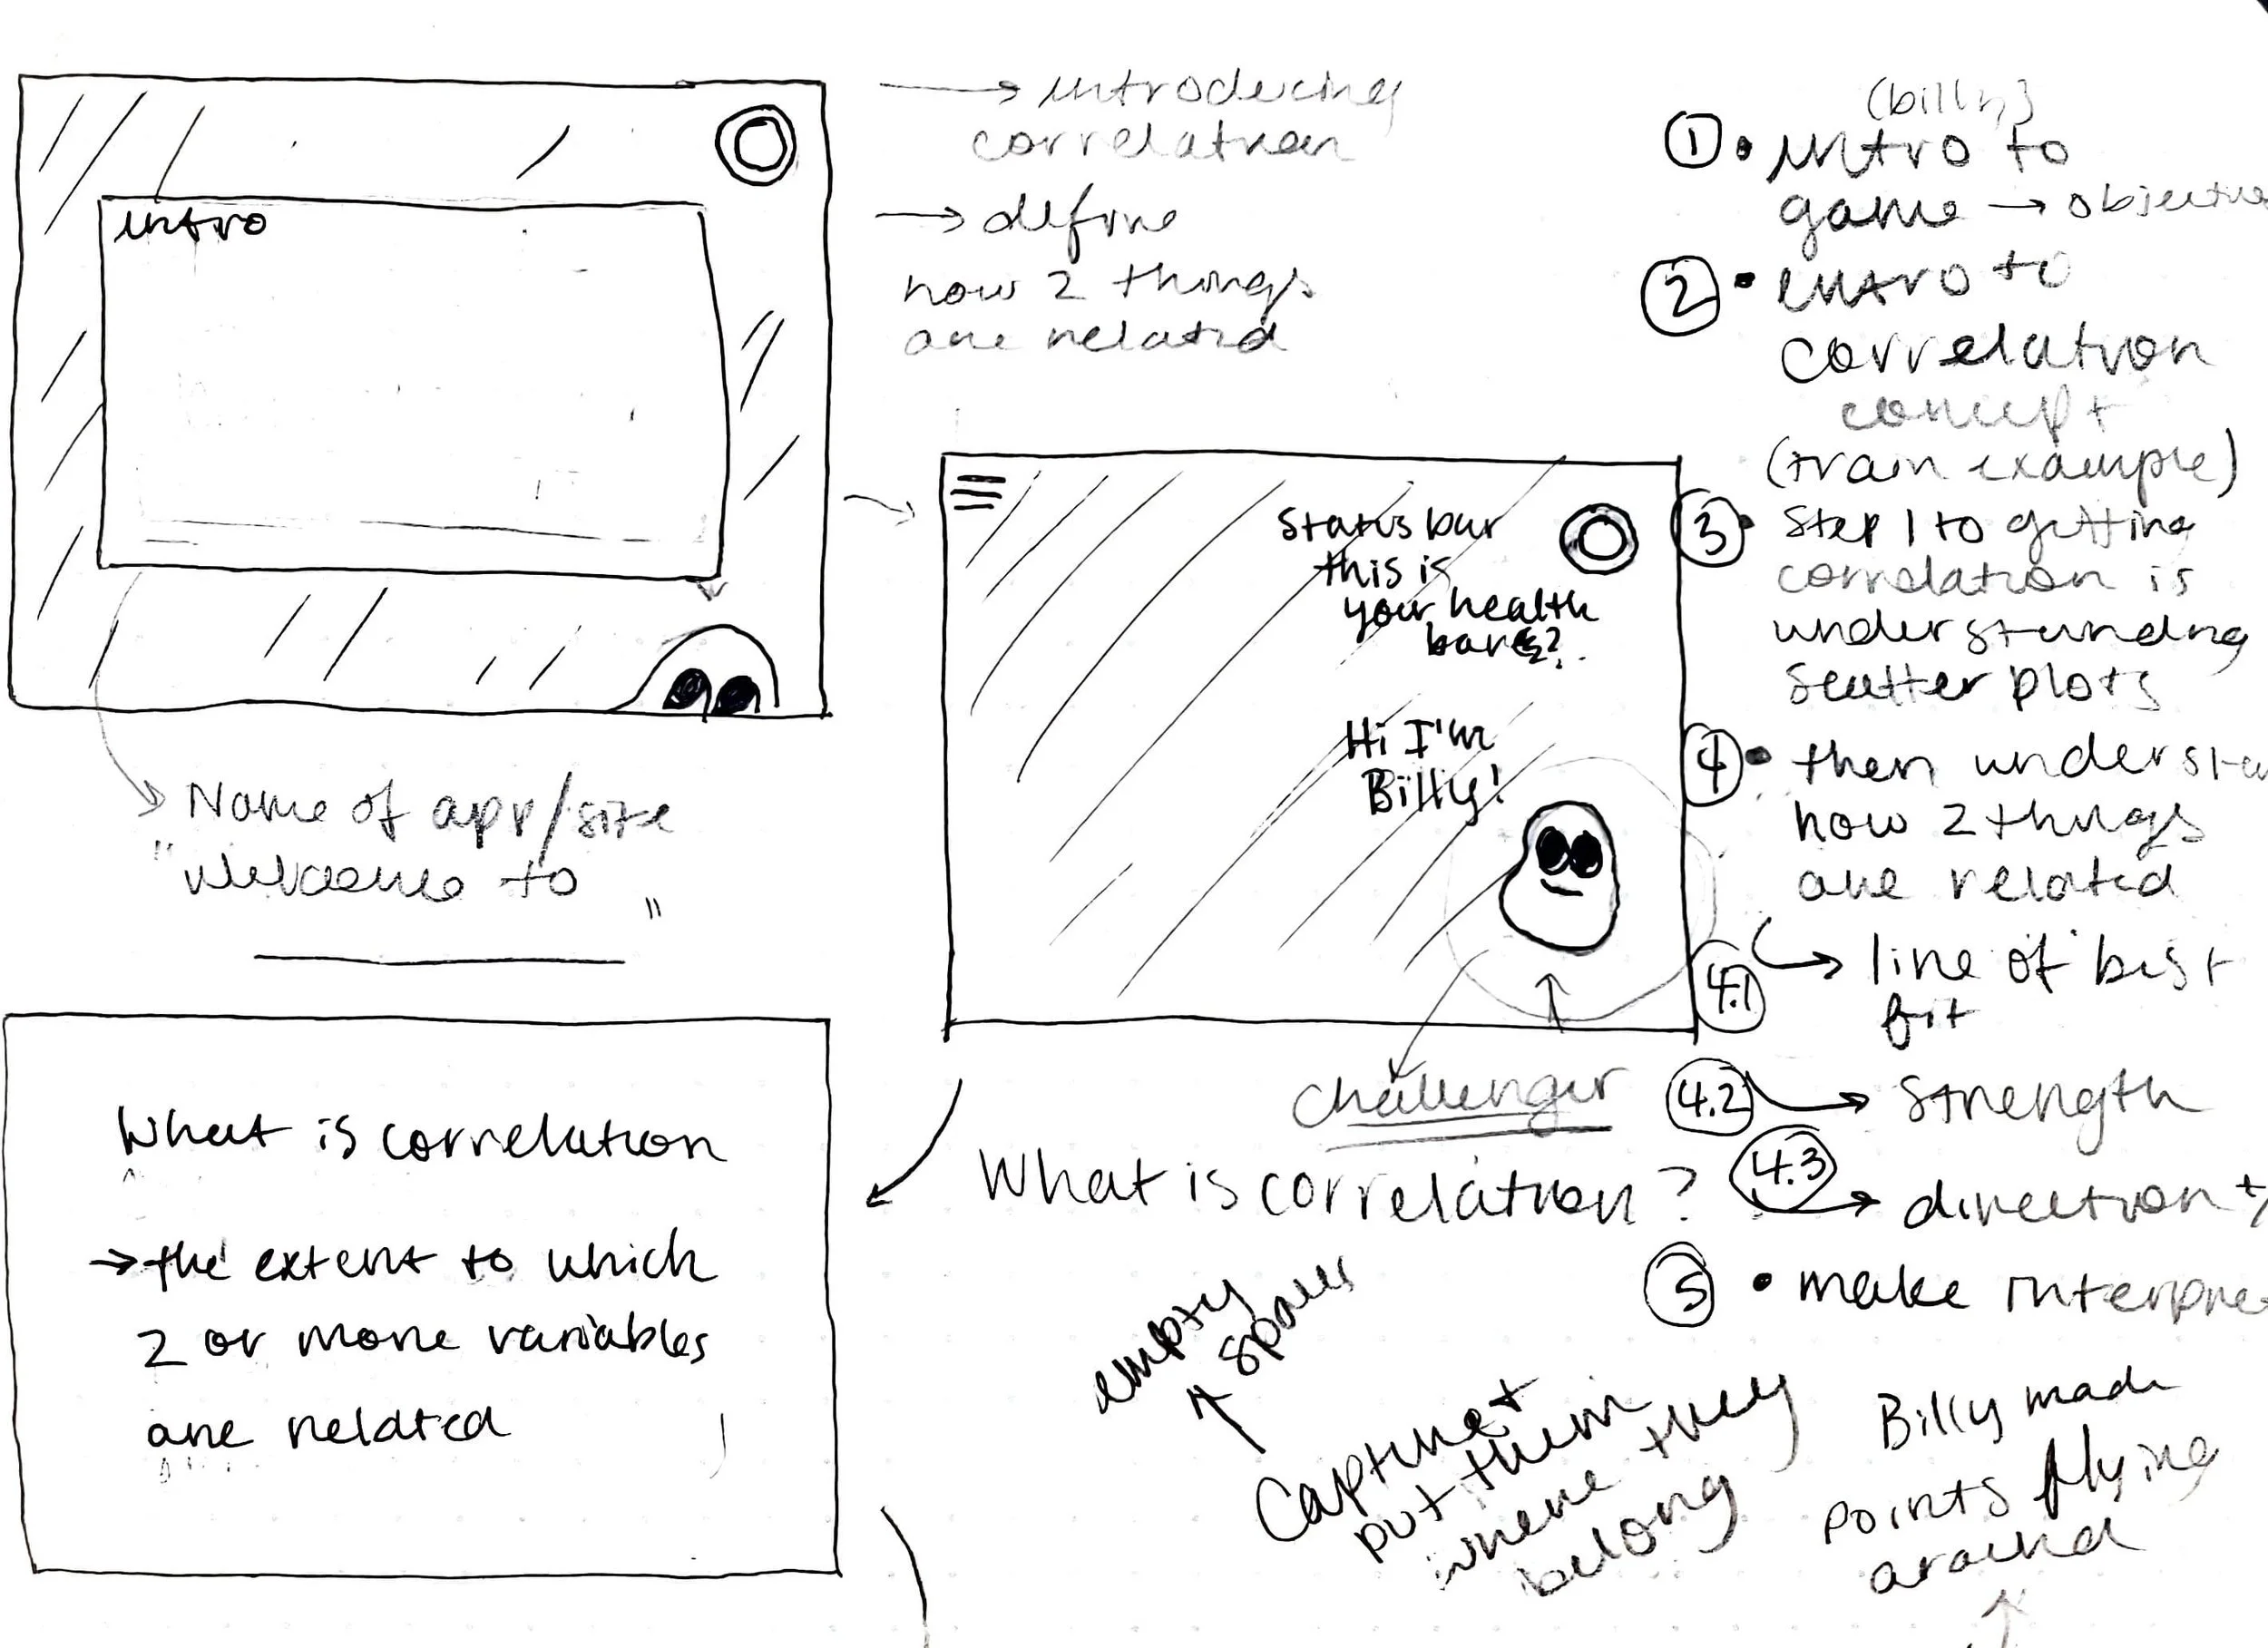
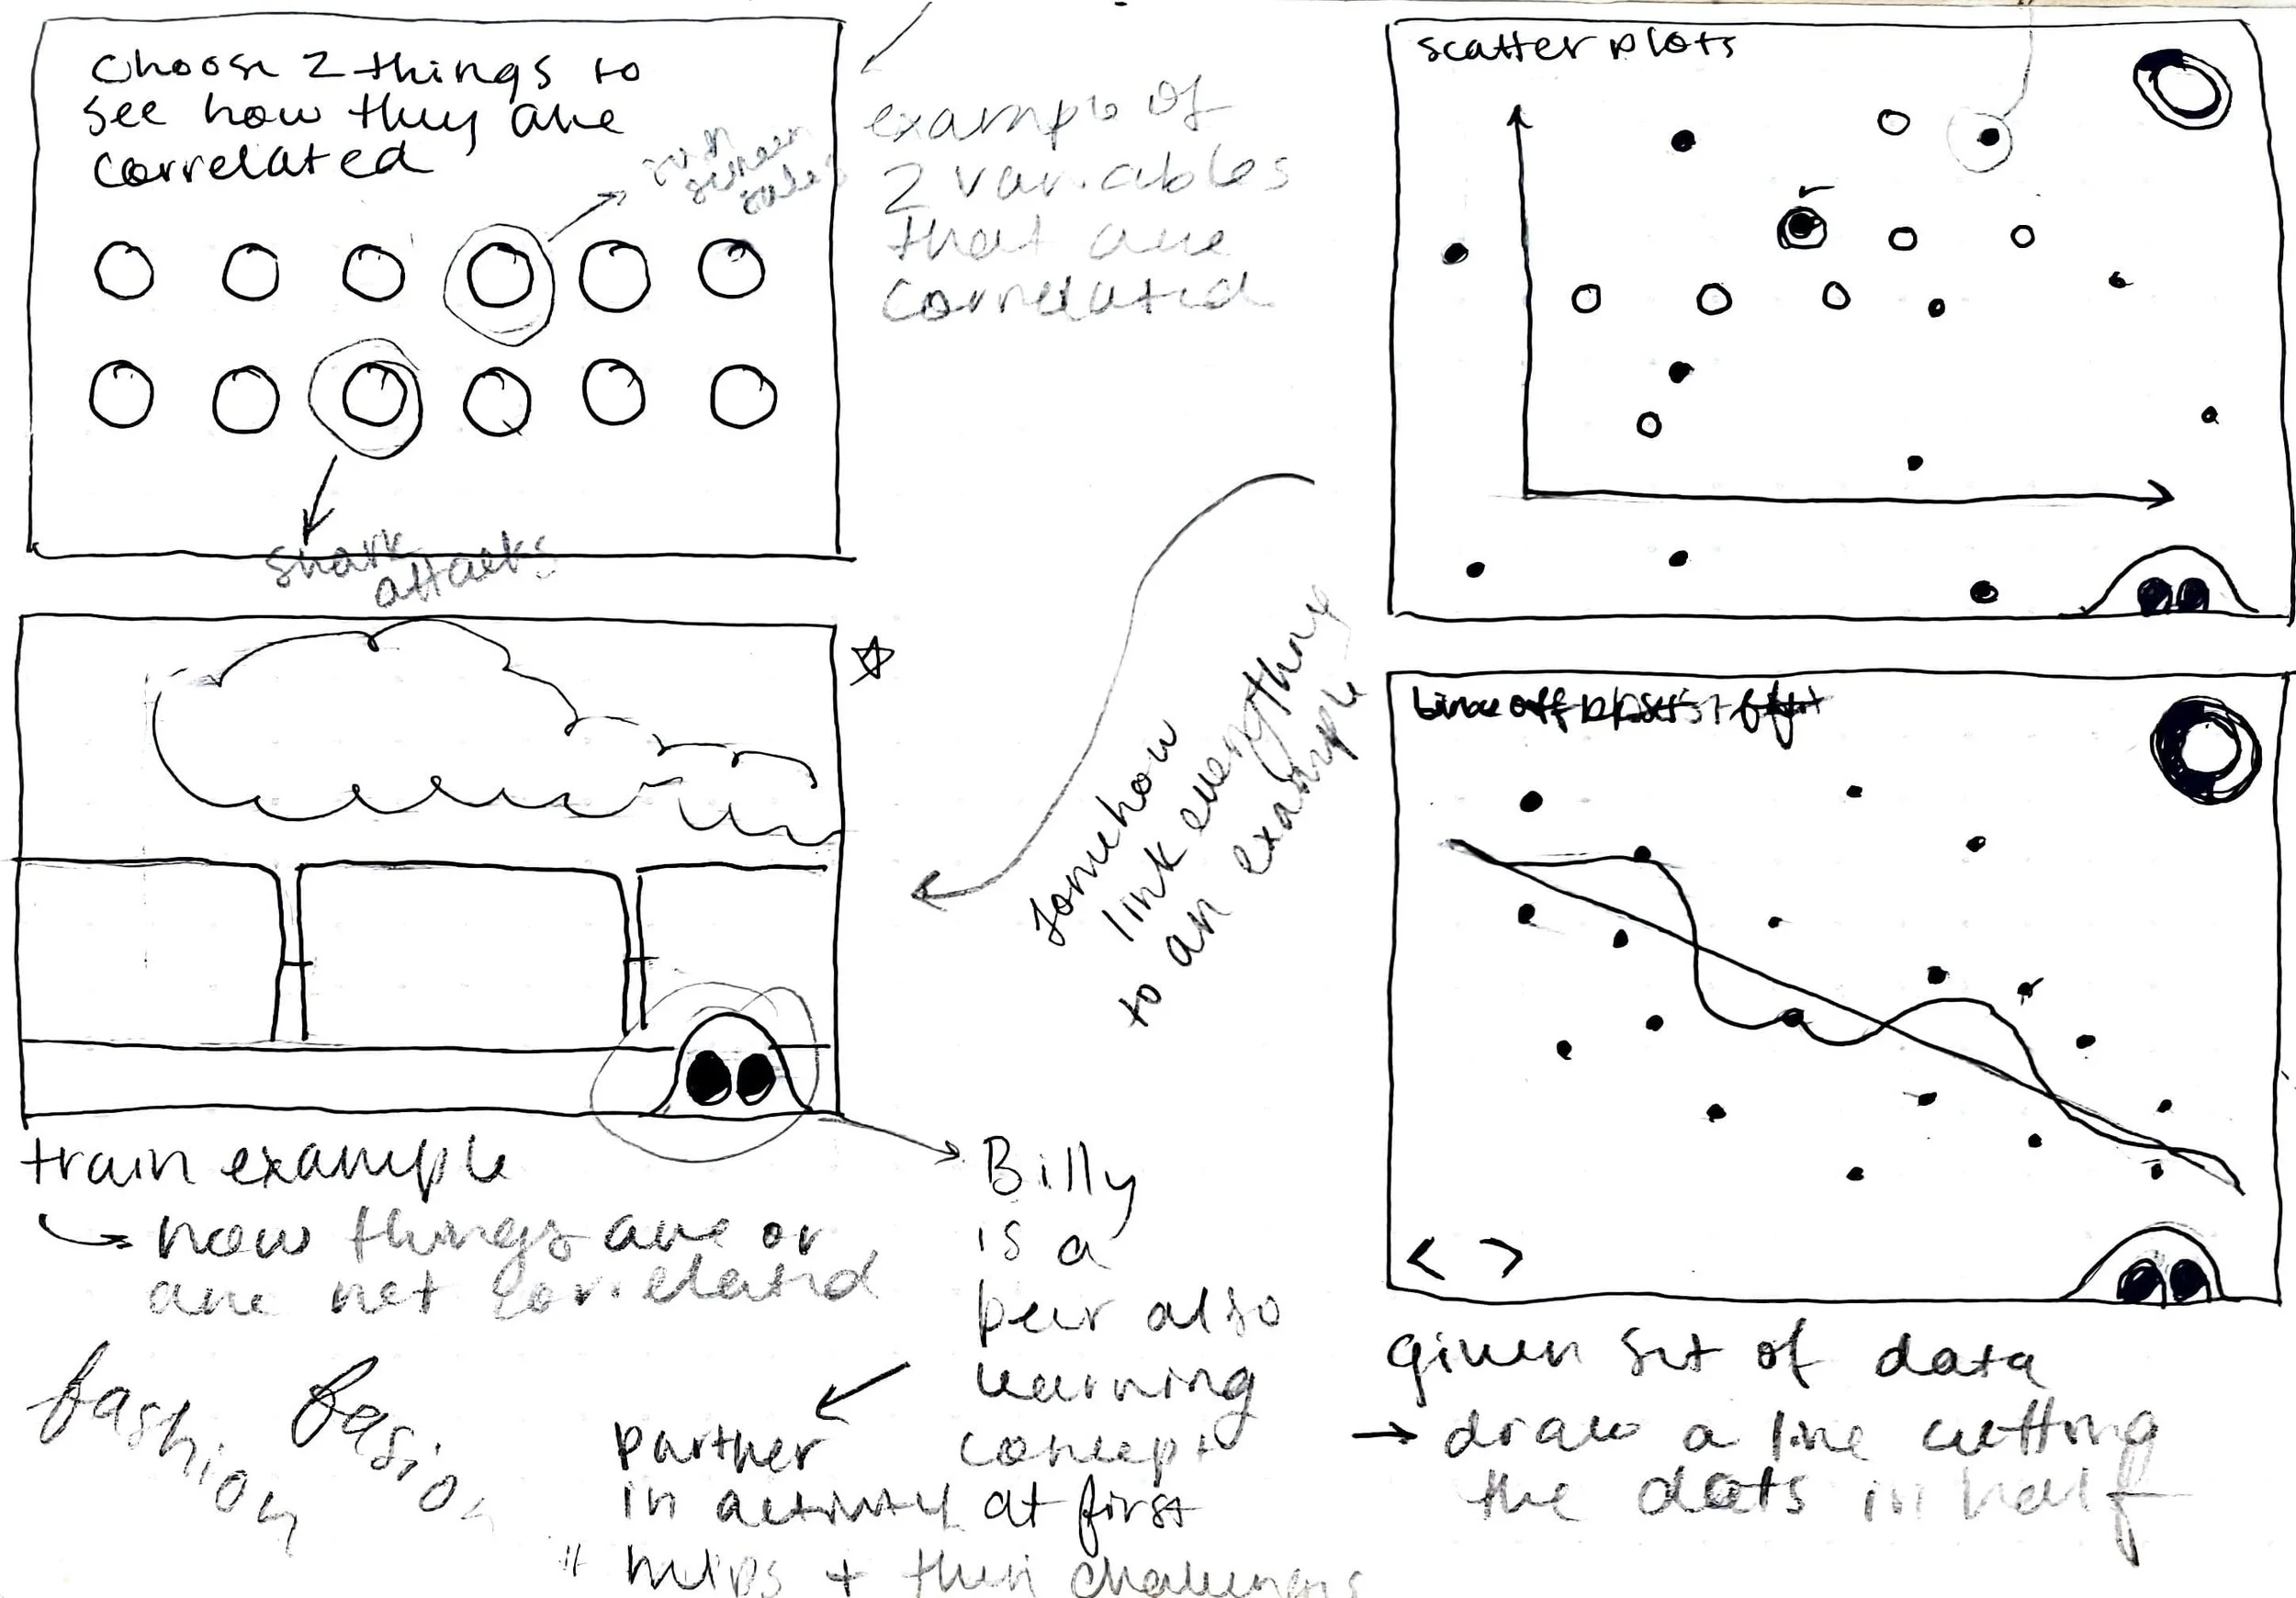
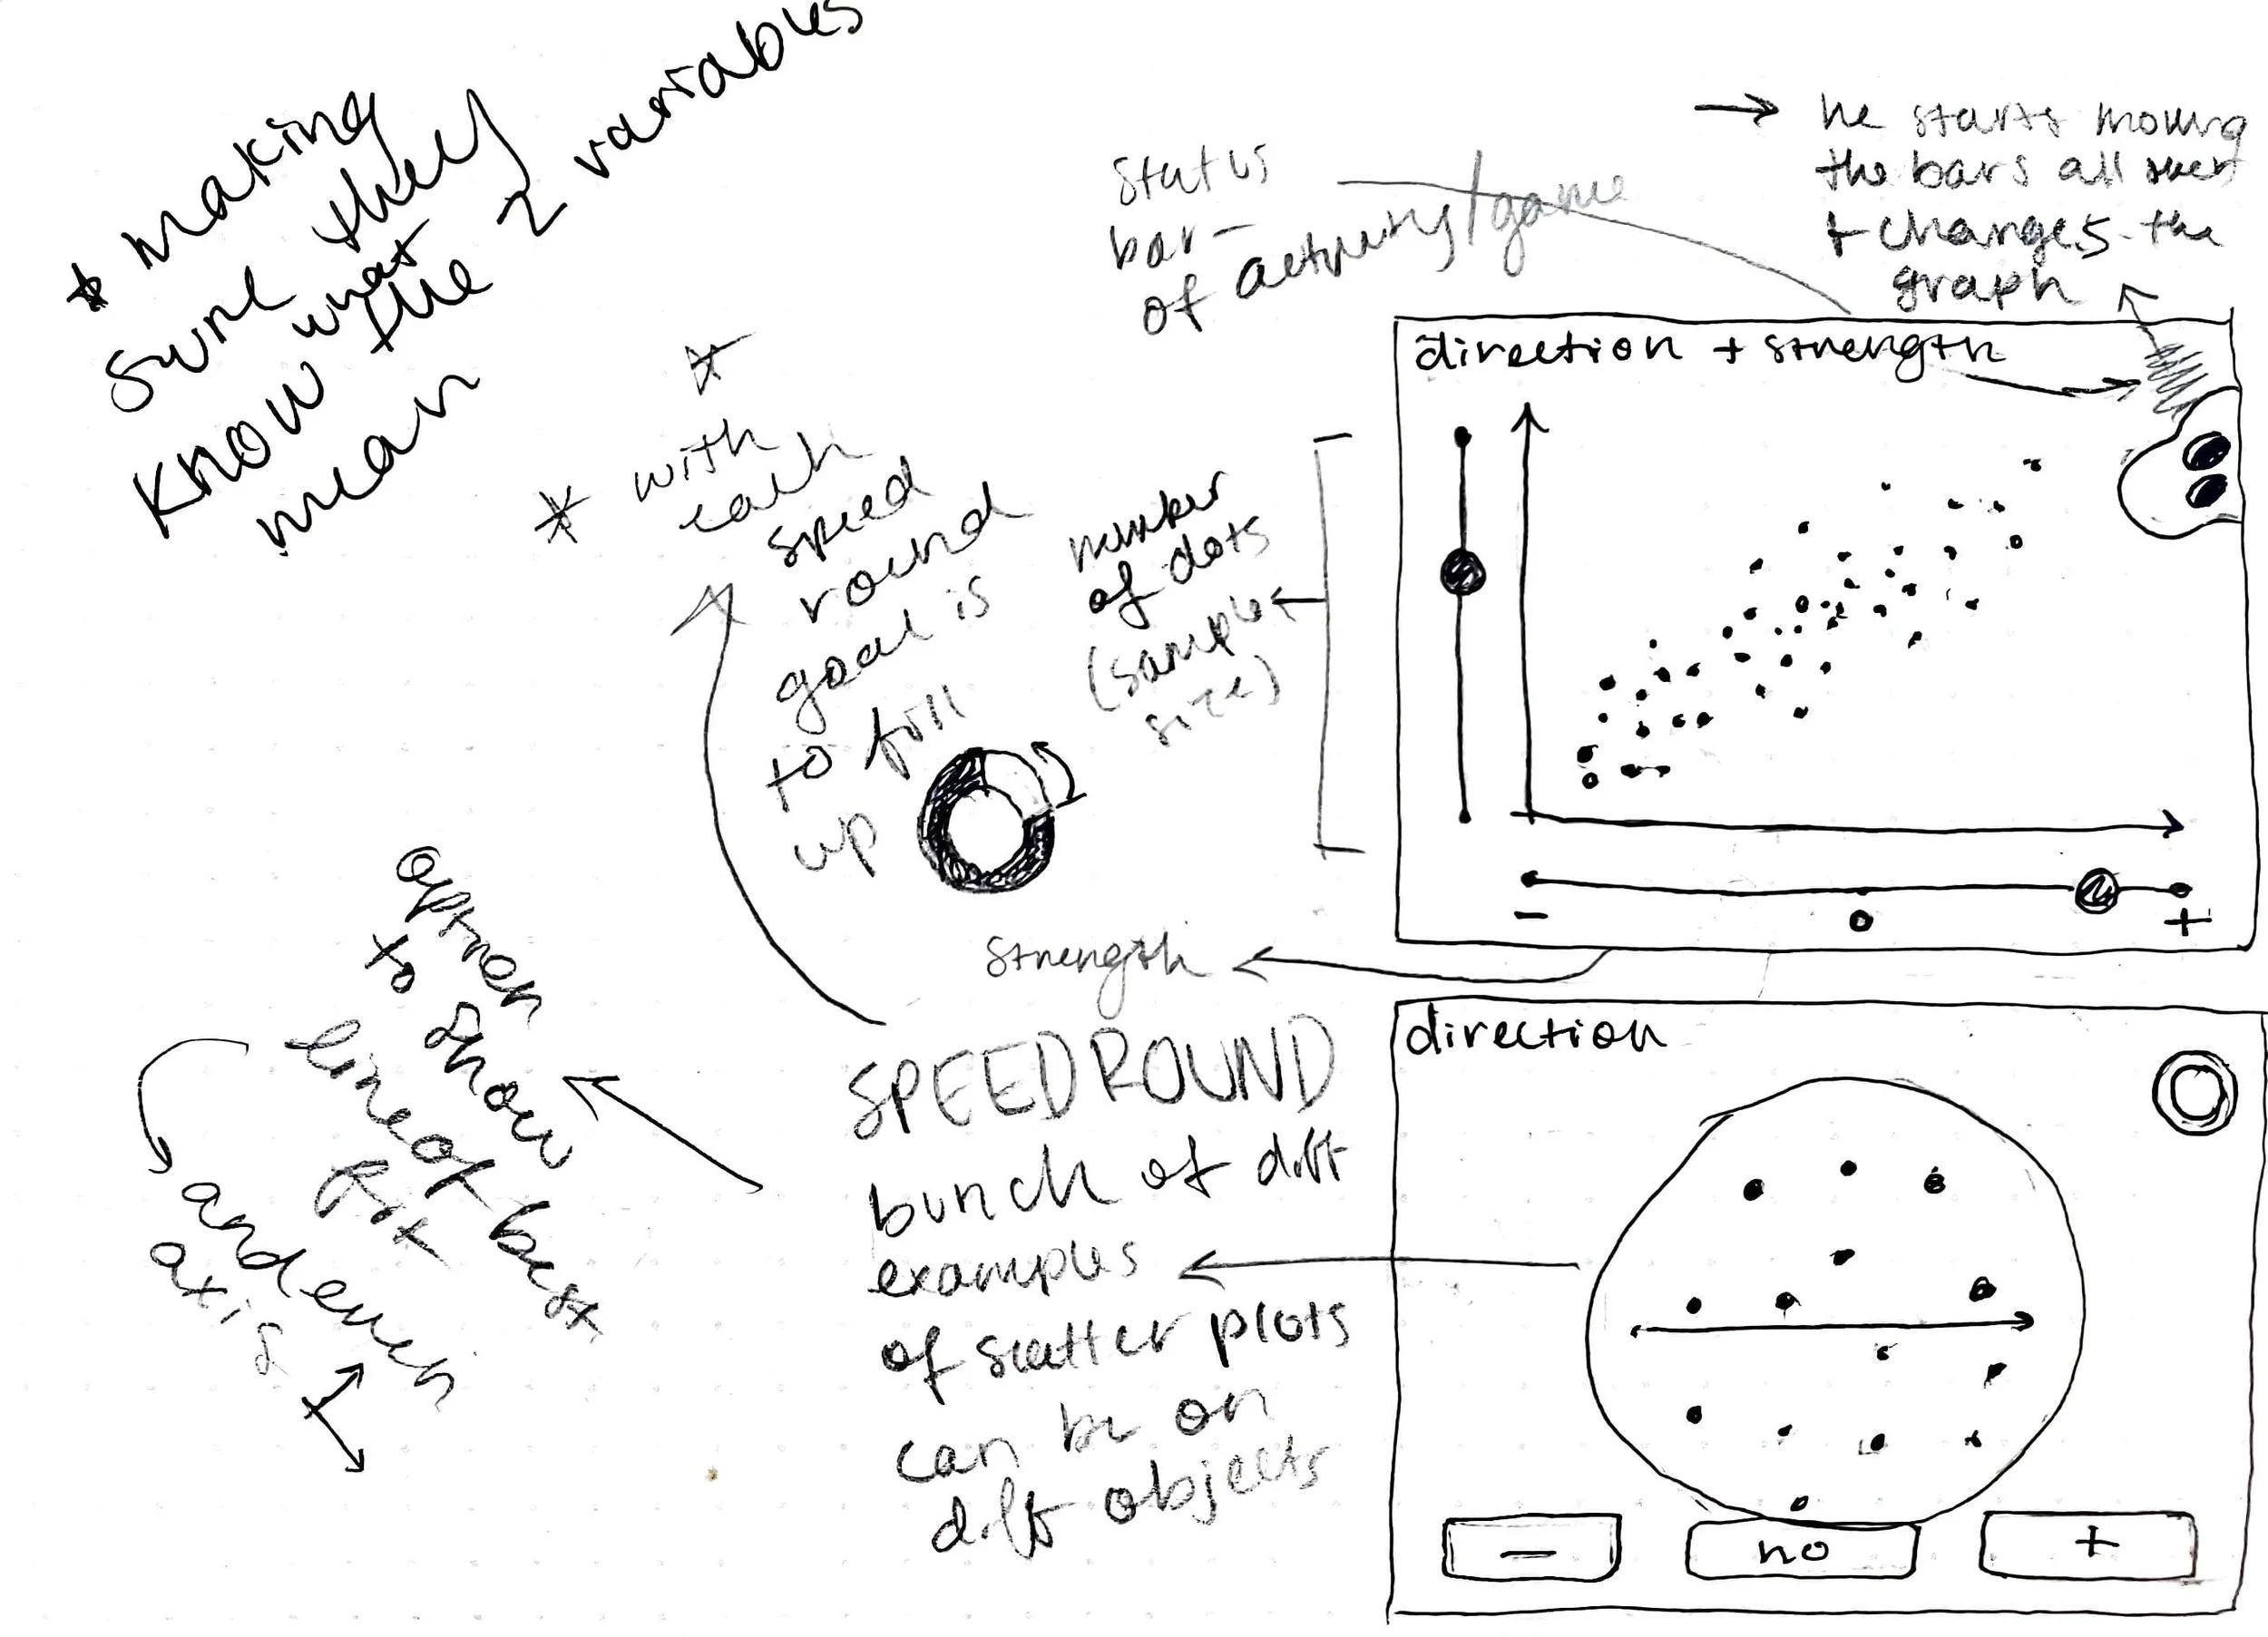
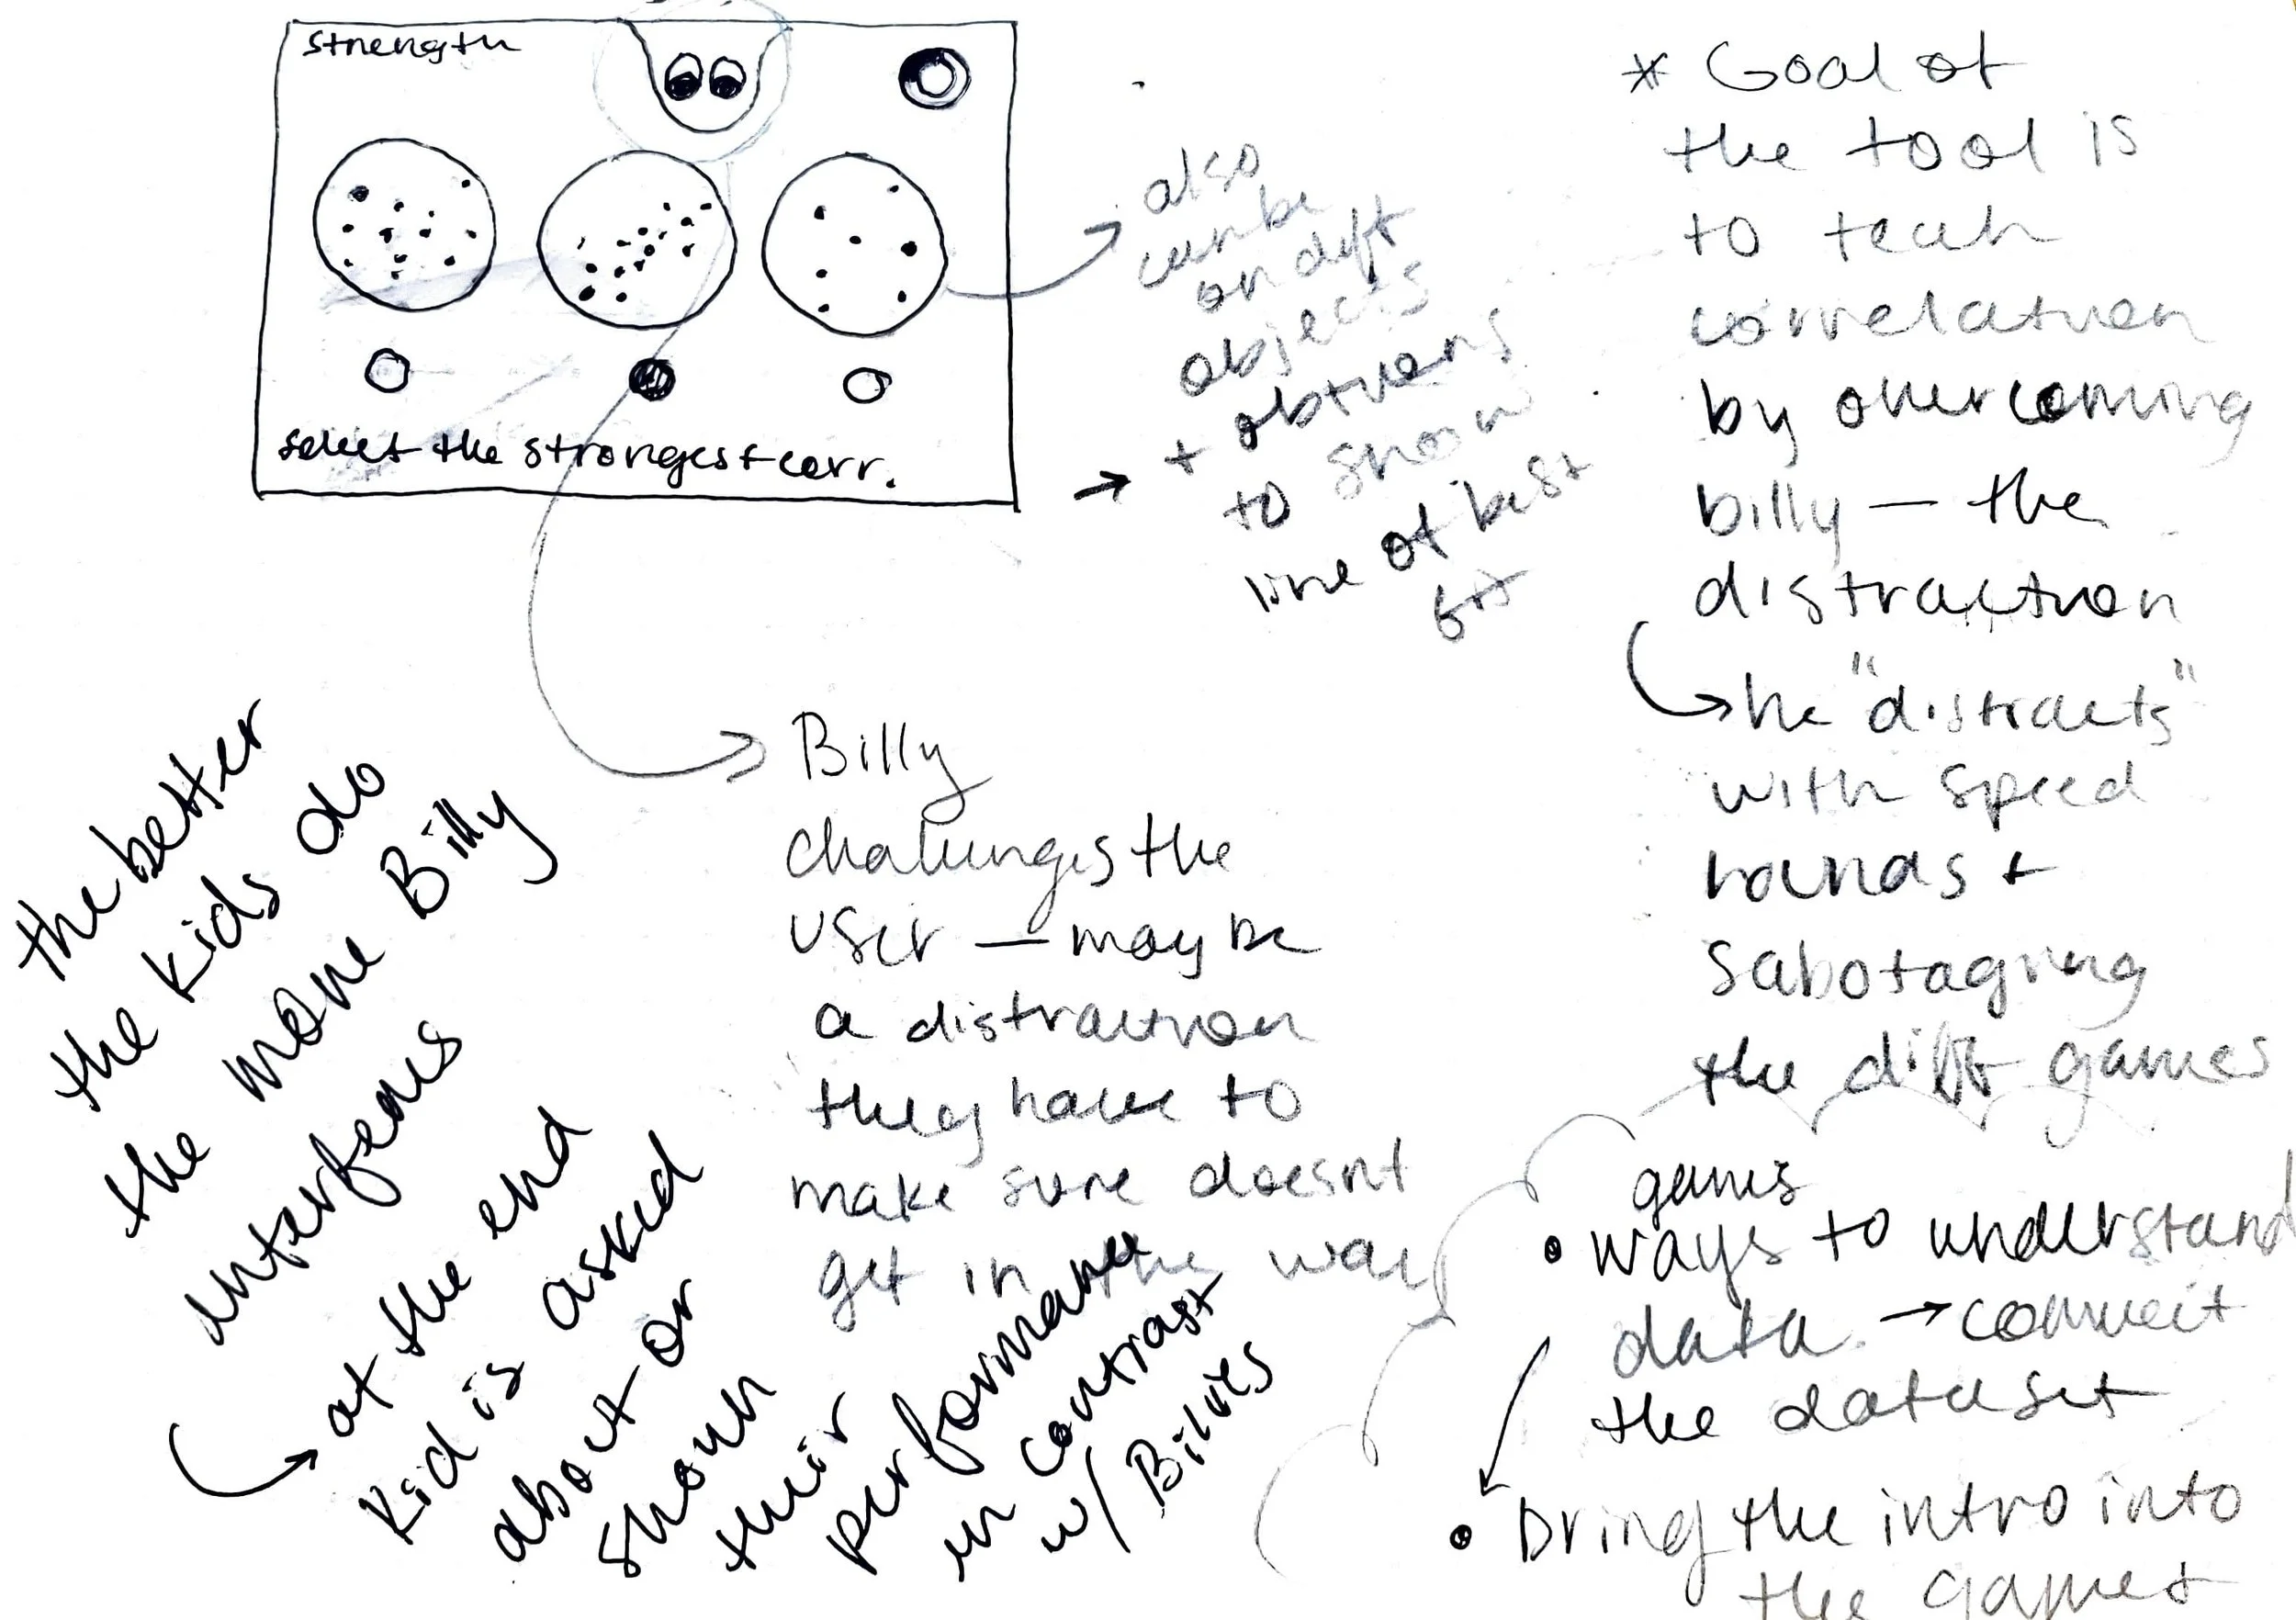
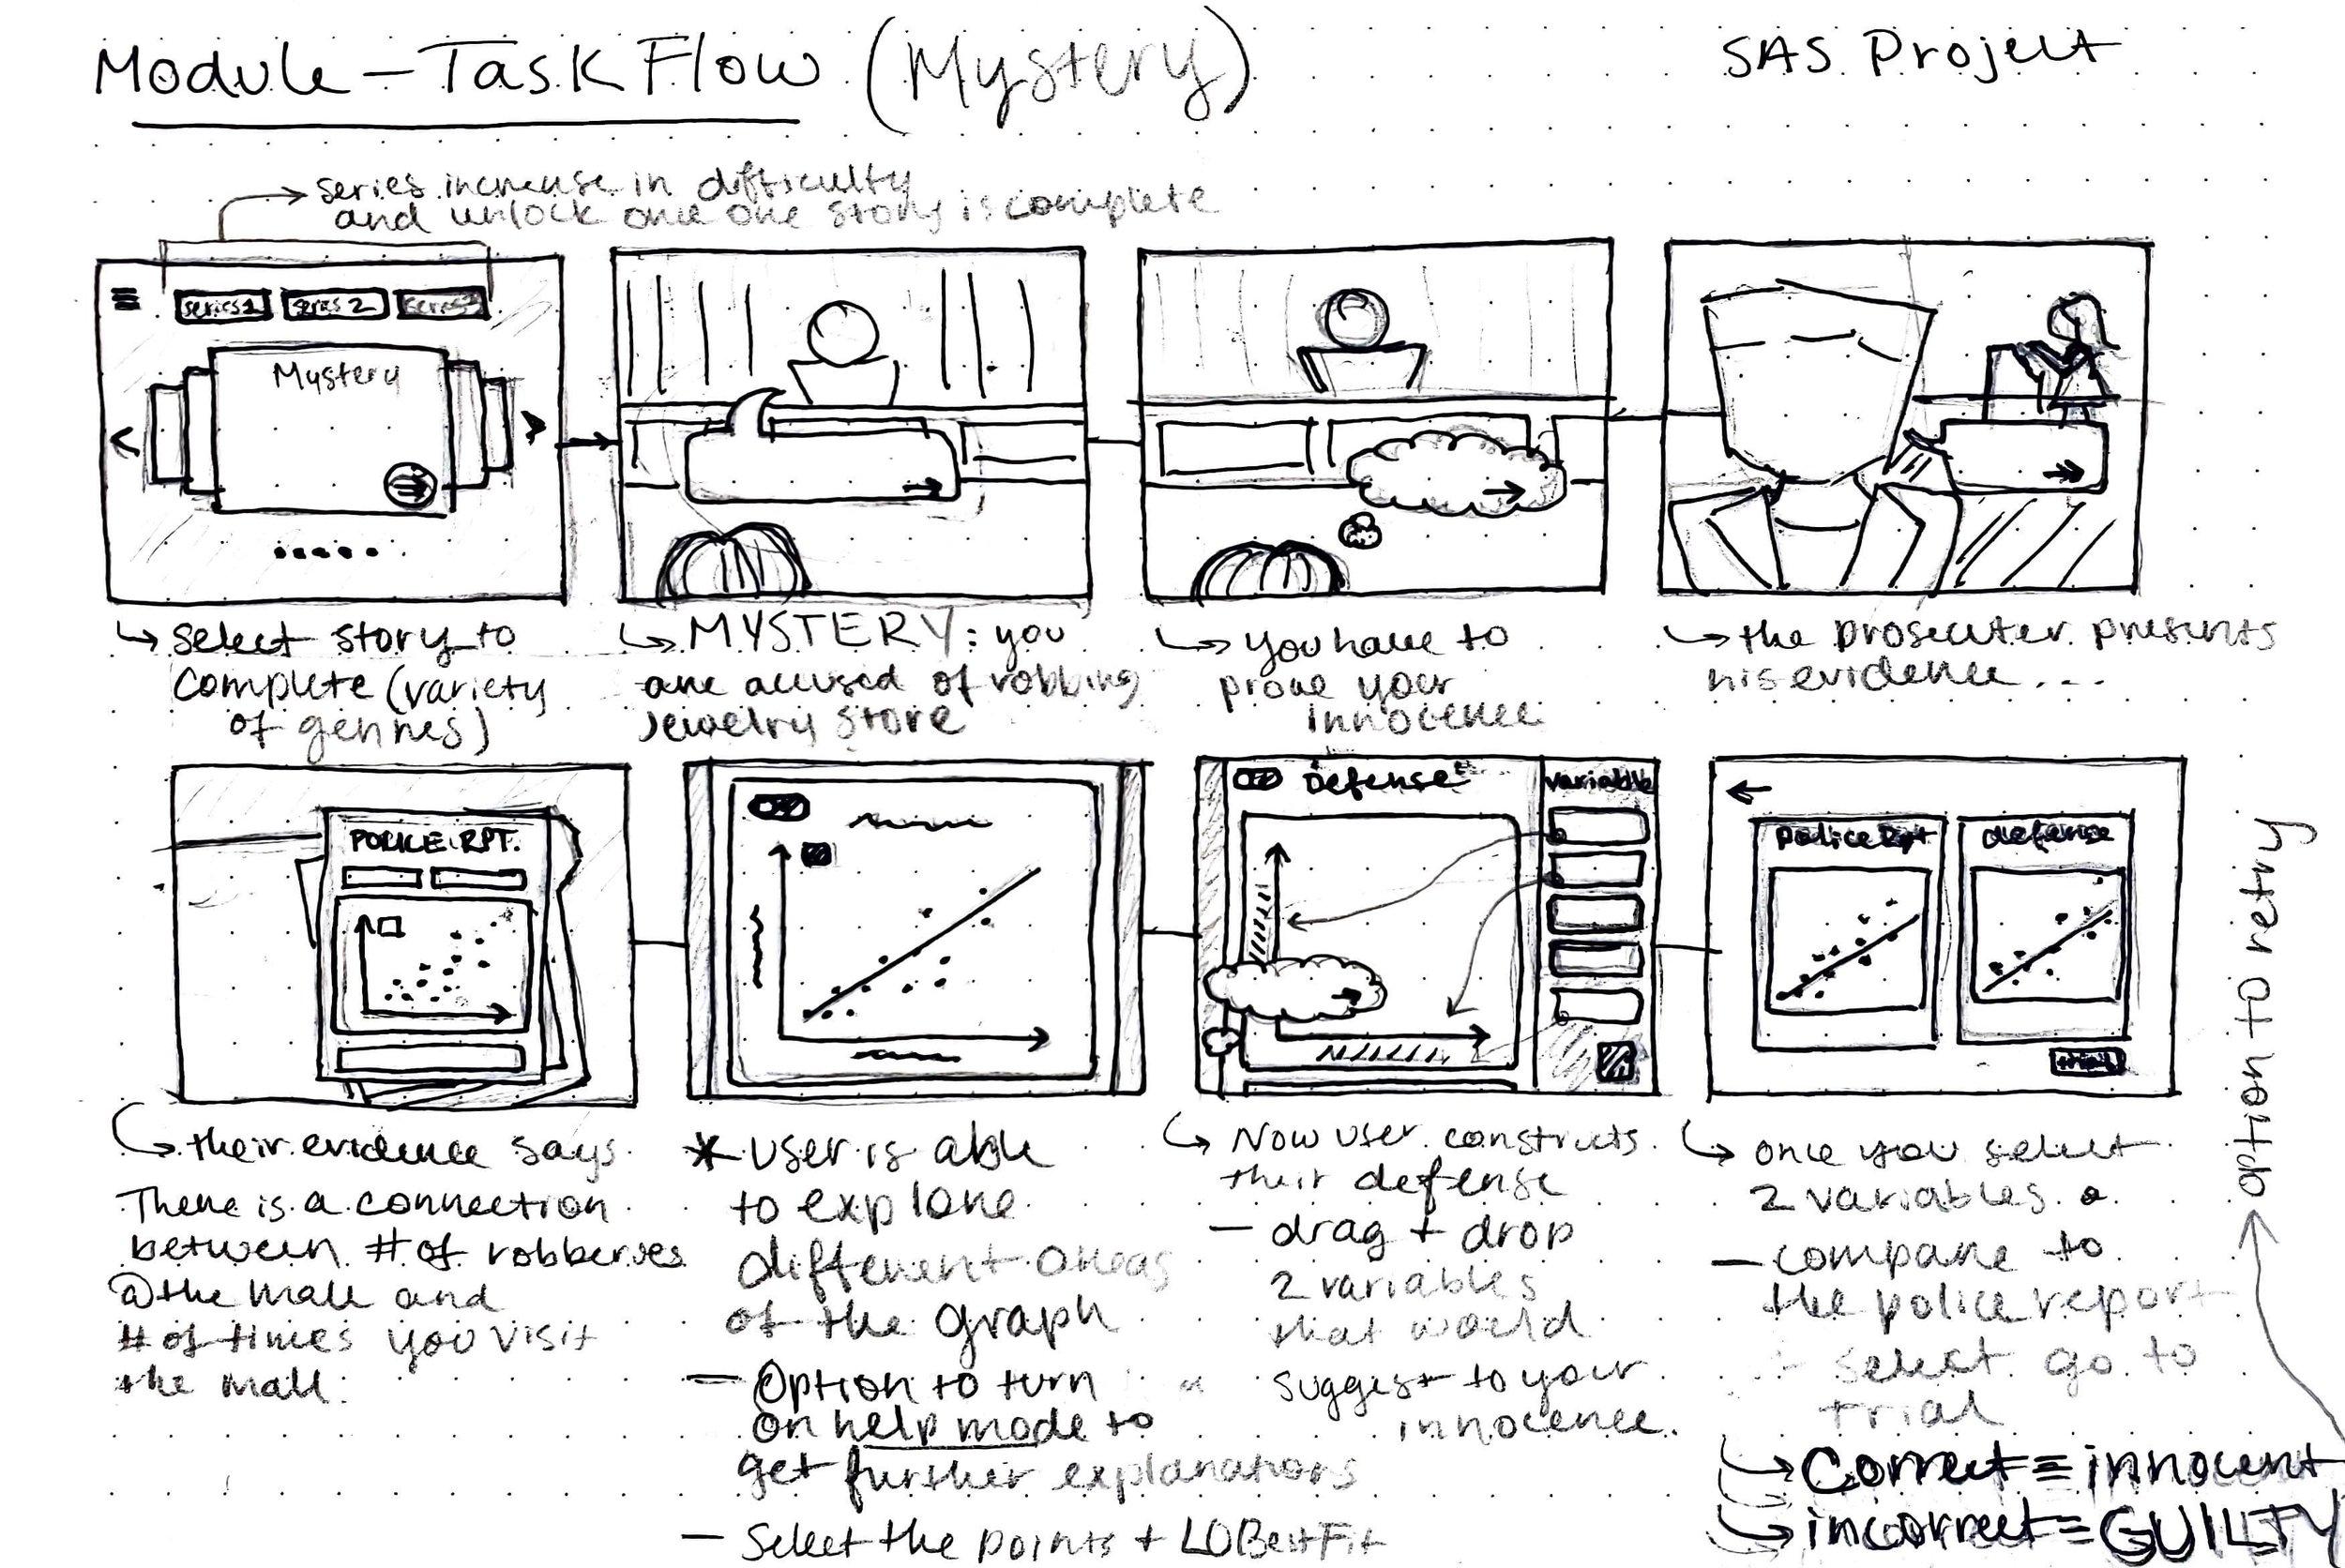
We began coming up with different ways we could use gamification, storytelling, and positive reinforcement to create an engaging experience kids would enjoy and want to continue interacting with. Since children have short attention spans our initial concepts consisted of short mini games that would help kids build a foundation of understanding of correlation that they could apply in the classroom. For example a mini game that specifically teaches them what a regression line is.

Concept Development
We then felt we needed to implement a more engaging storyline as the mini games might not have maintained the students attention for long enough or given them incentive to want to continue playing. We came up with the idea to drop the student in a problem scenario where they would need to use correlation to work their way out of it.


SAS Visits
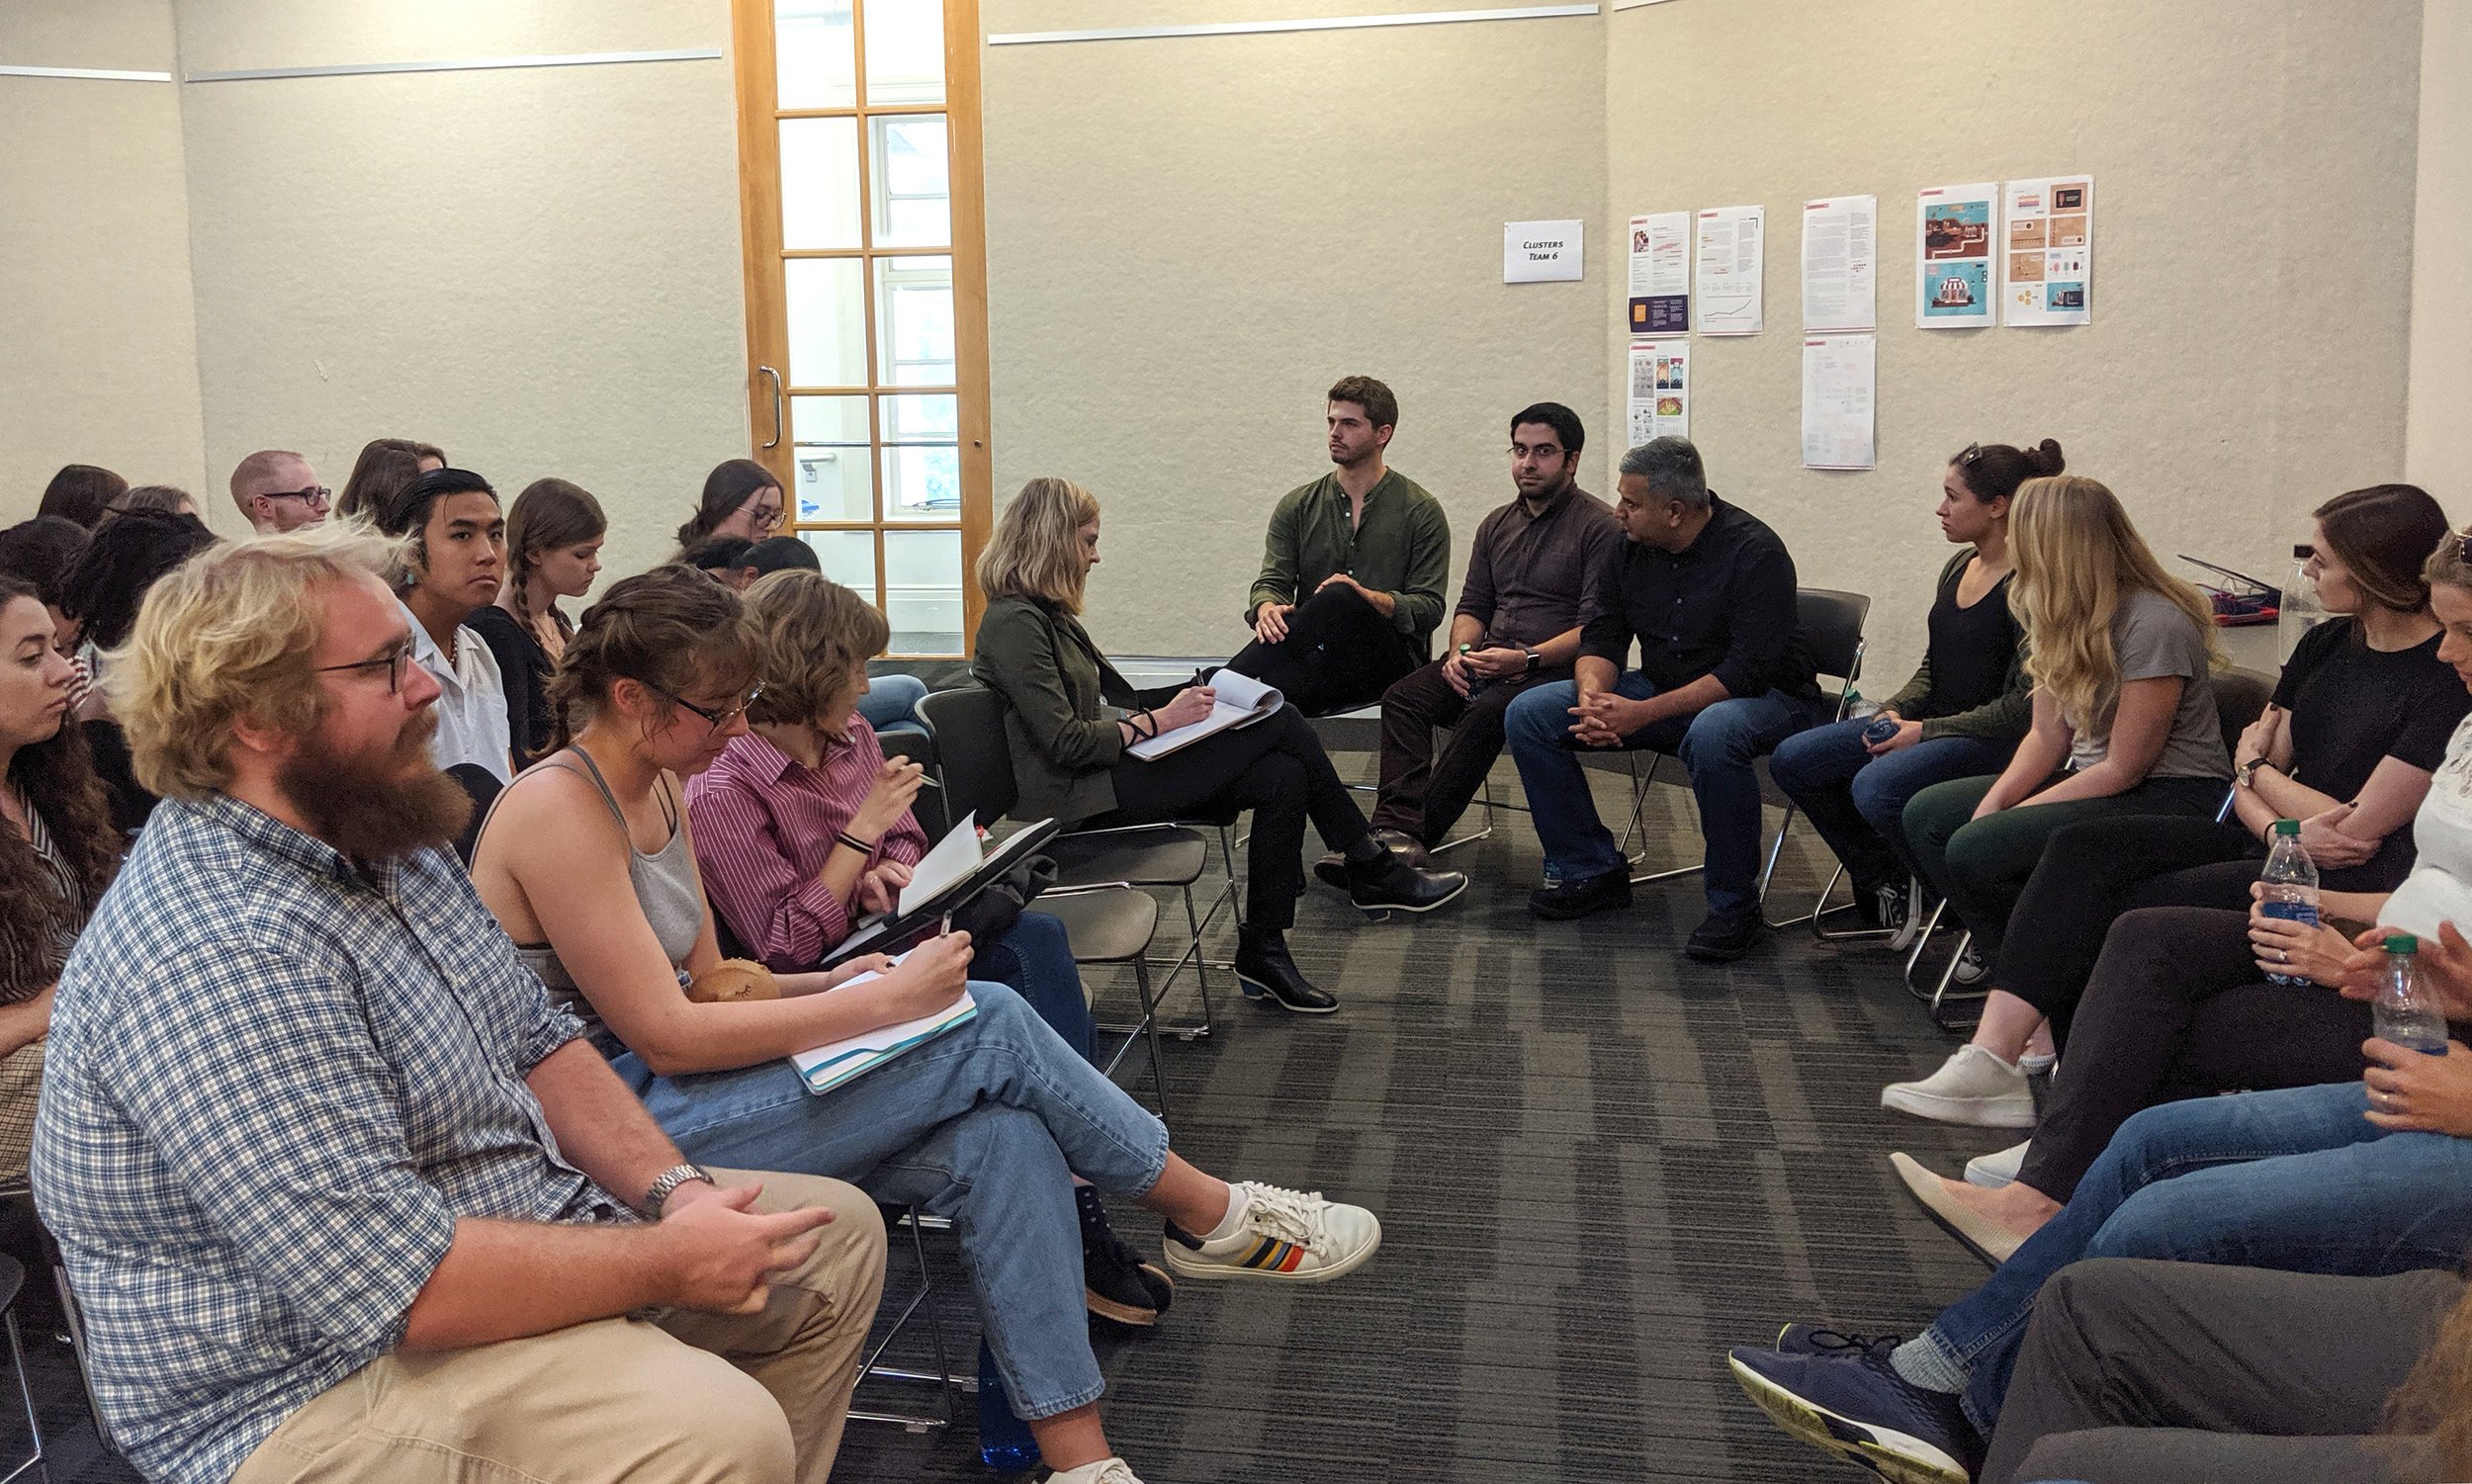
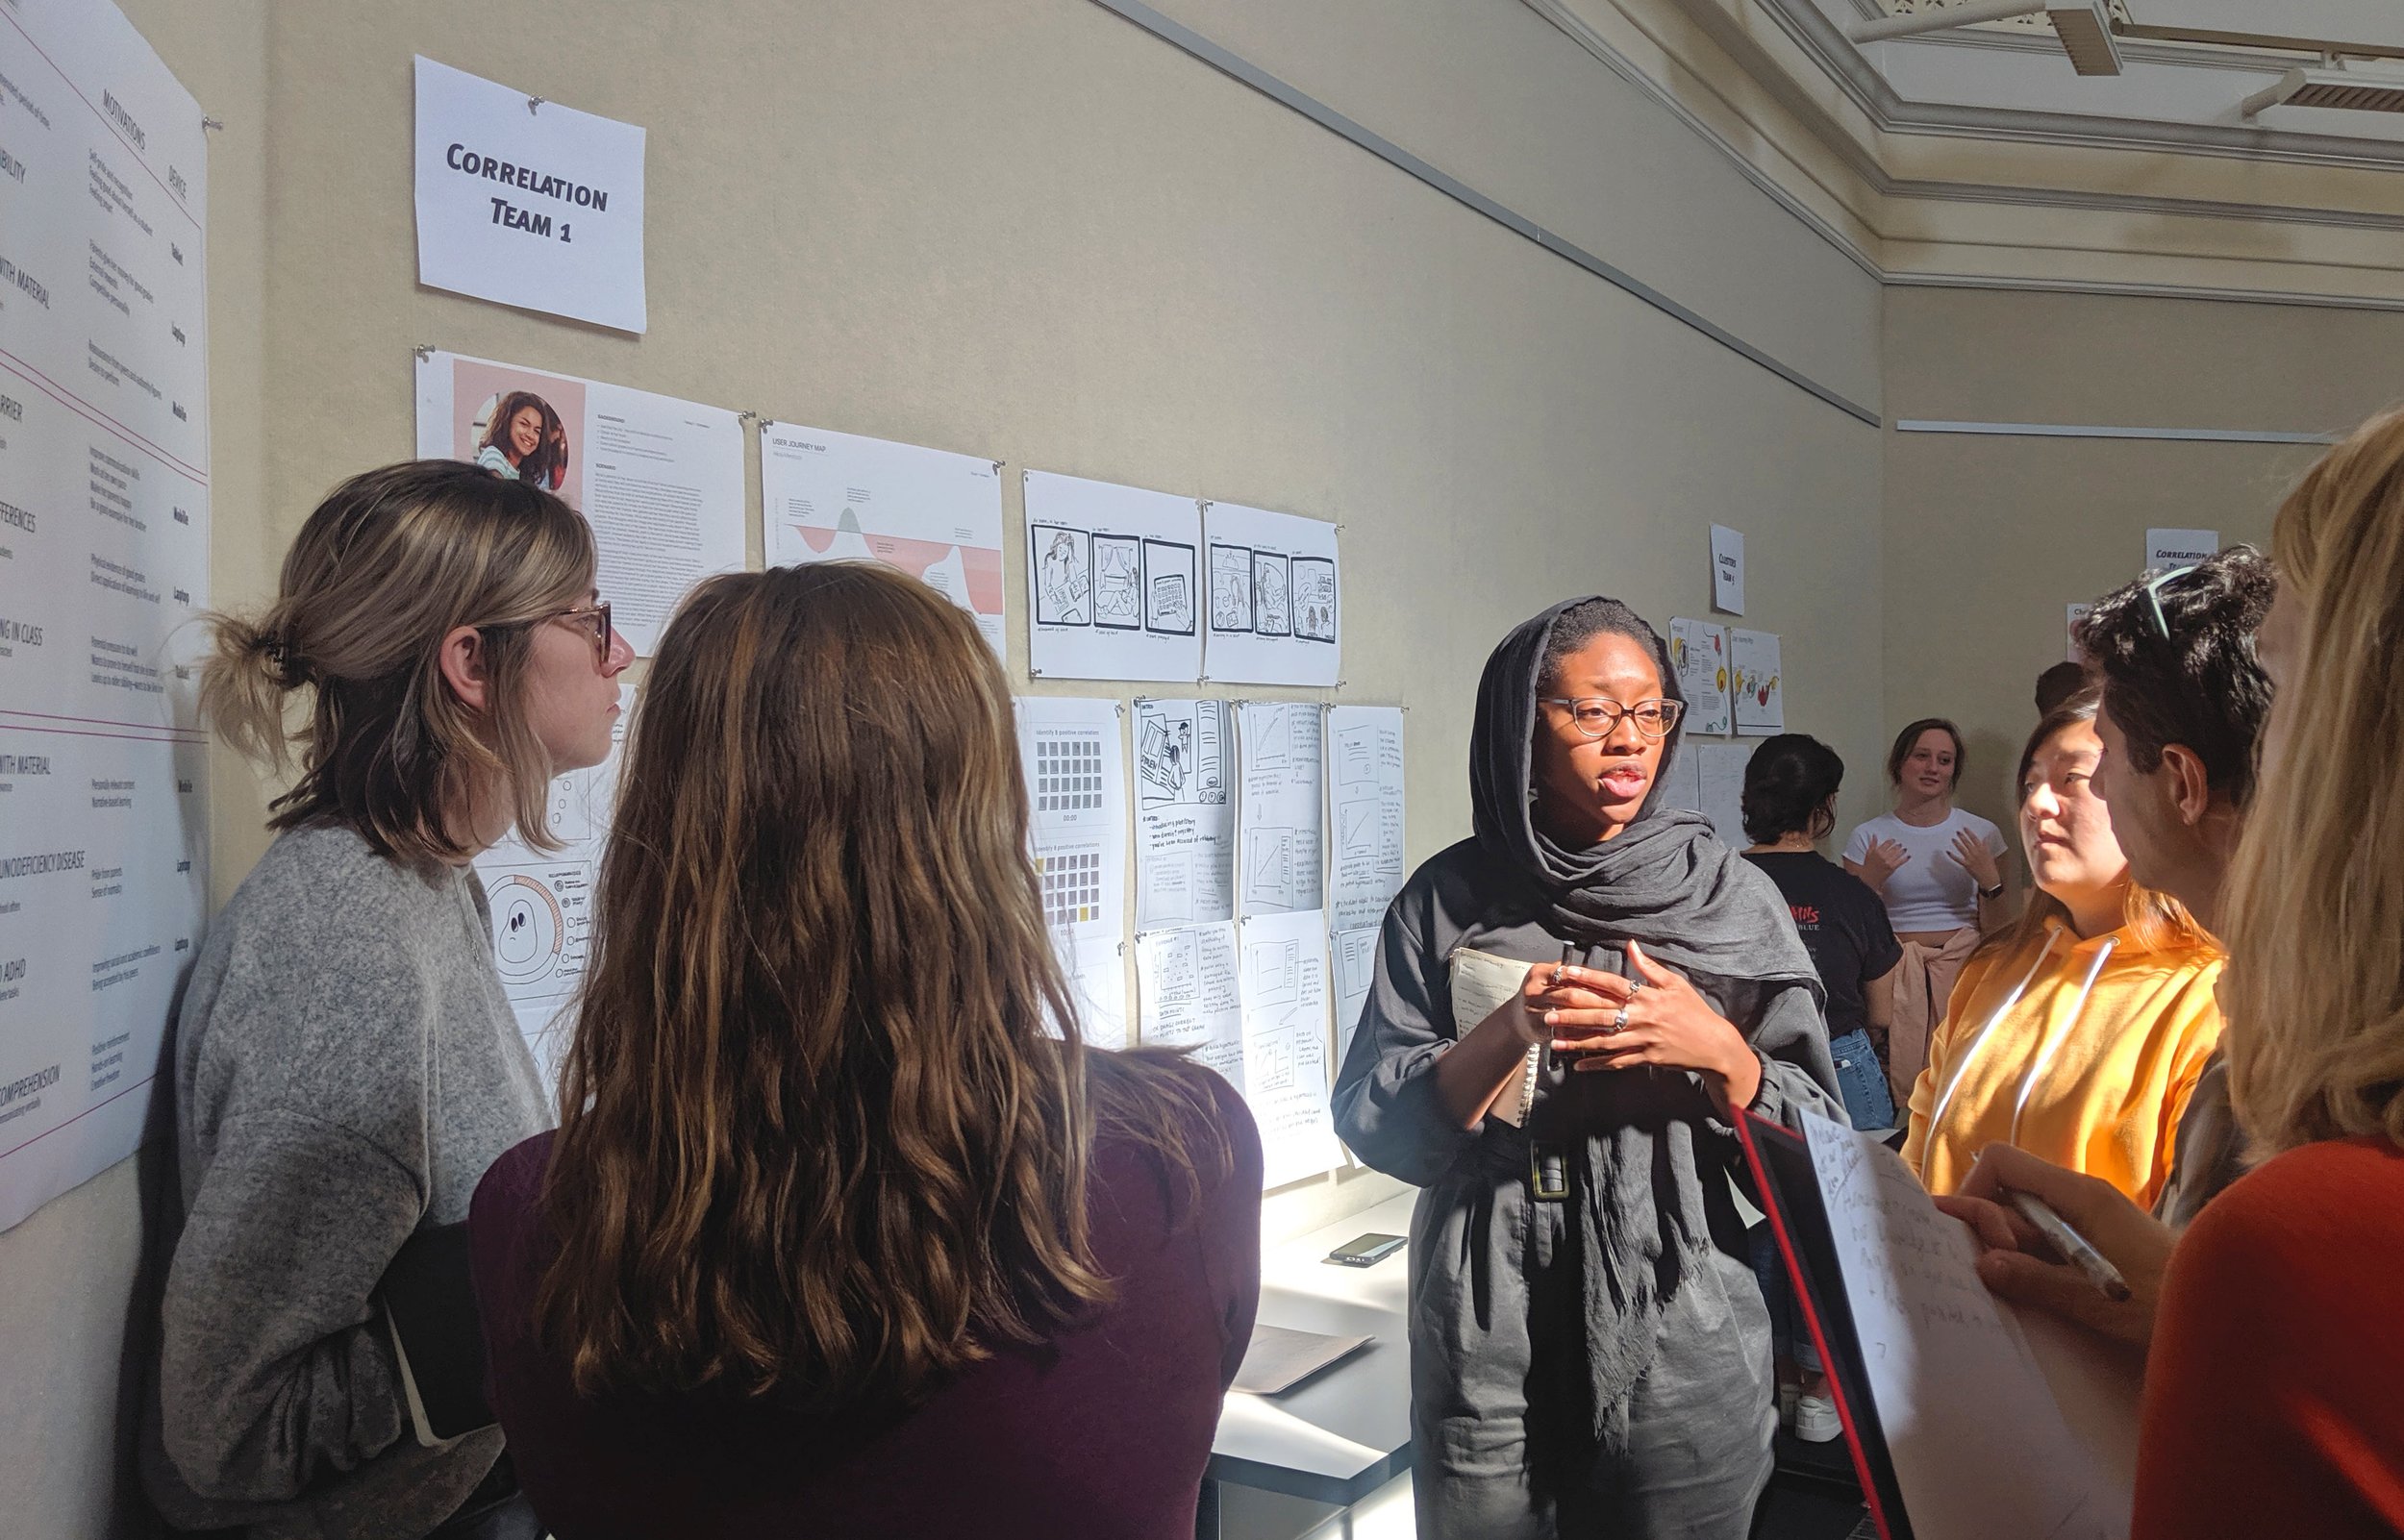
We periodically presented our findings and project development with the SAS team. SAS worked with us to critique and refine our ideas. Their insight along with our research findings was helpful in developing a more successful product.

User Testing
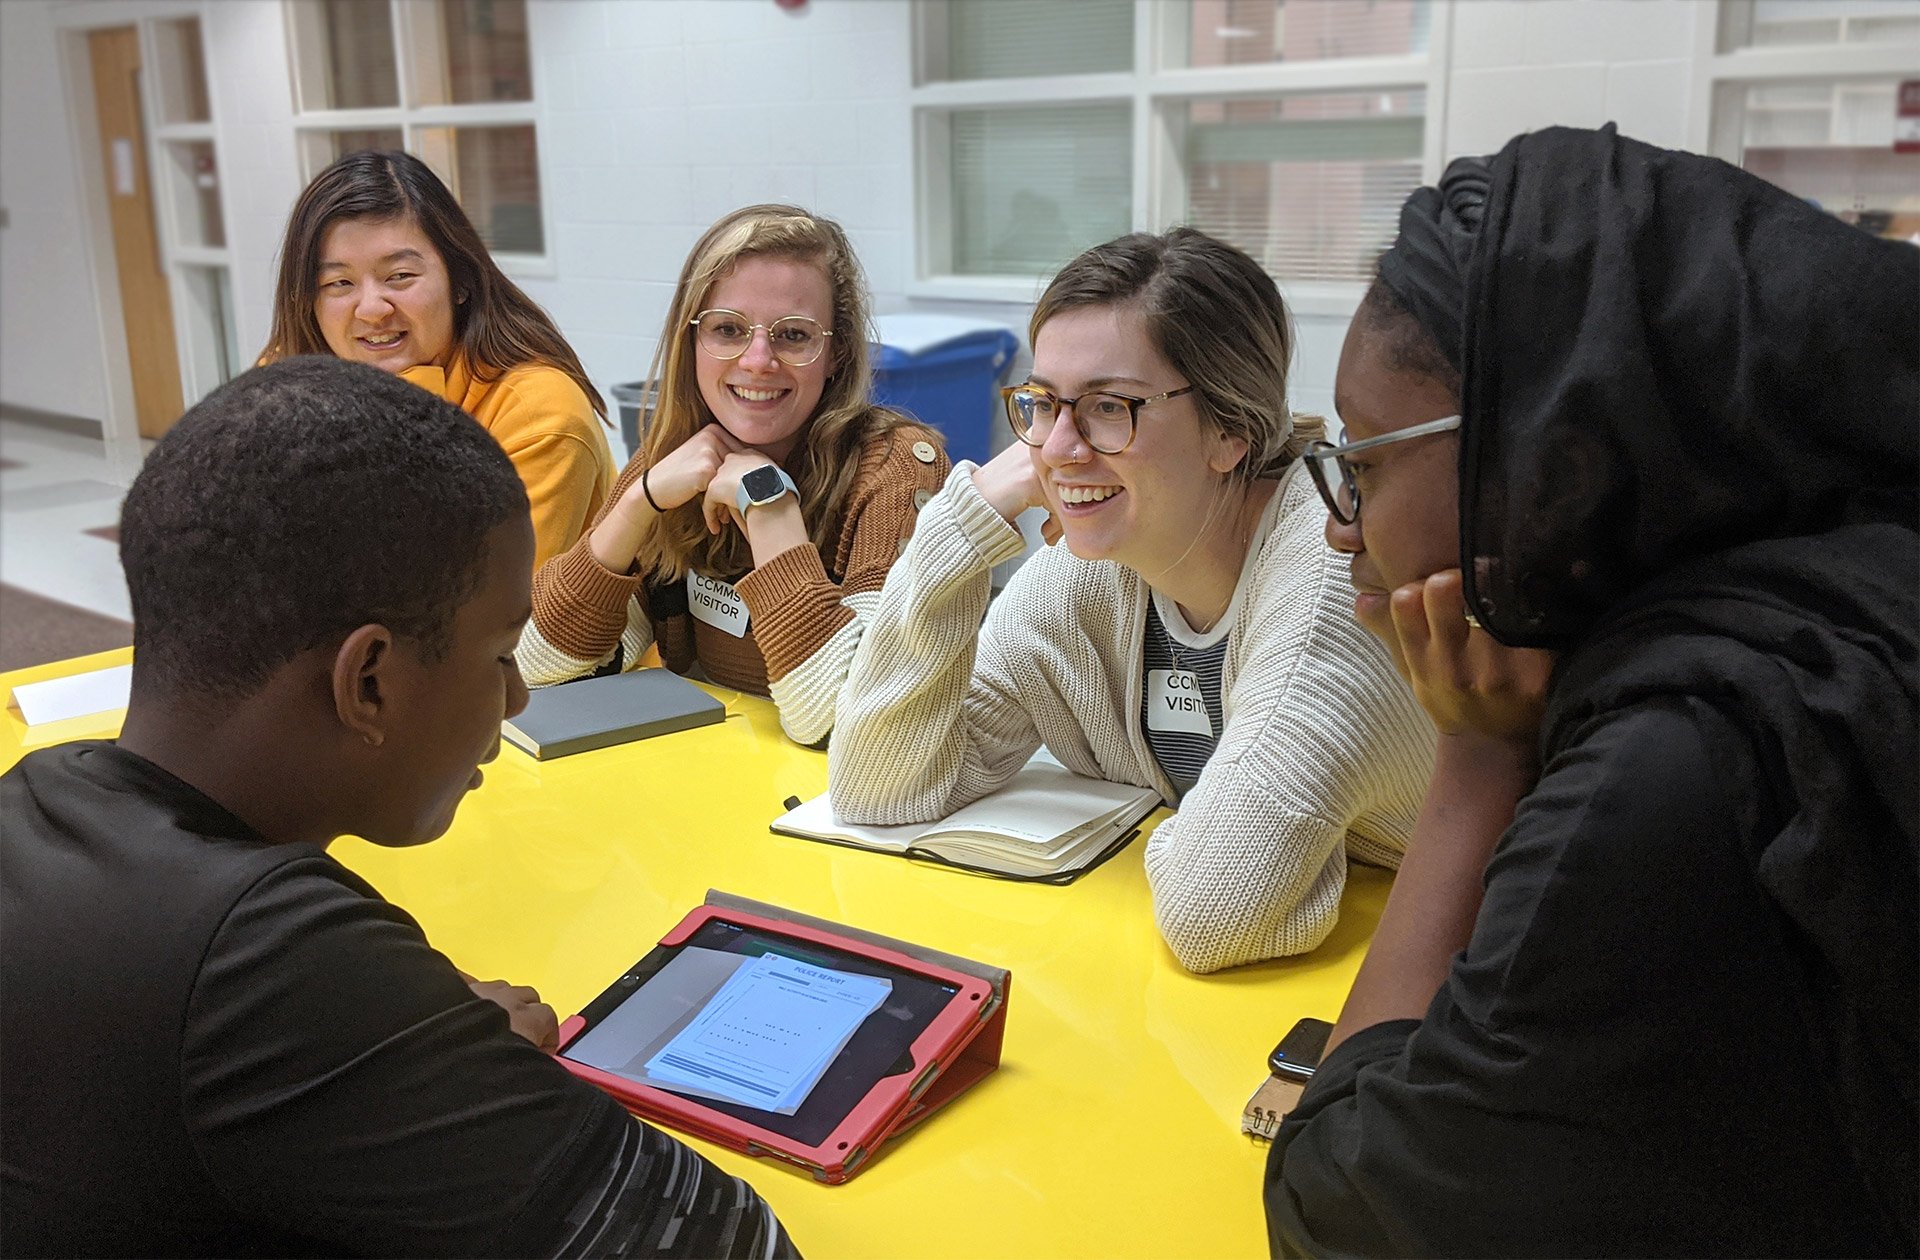
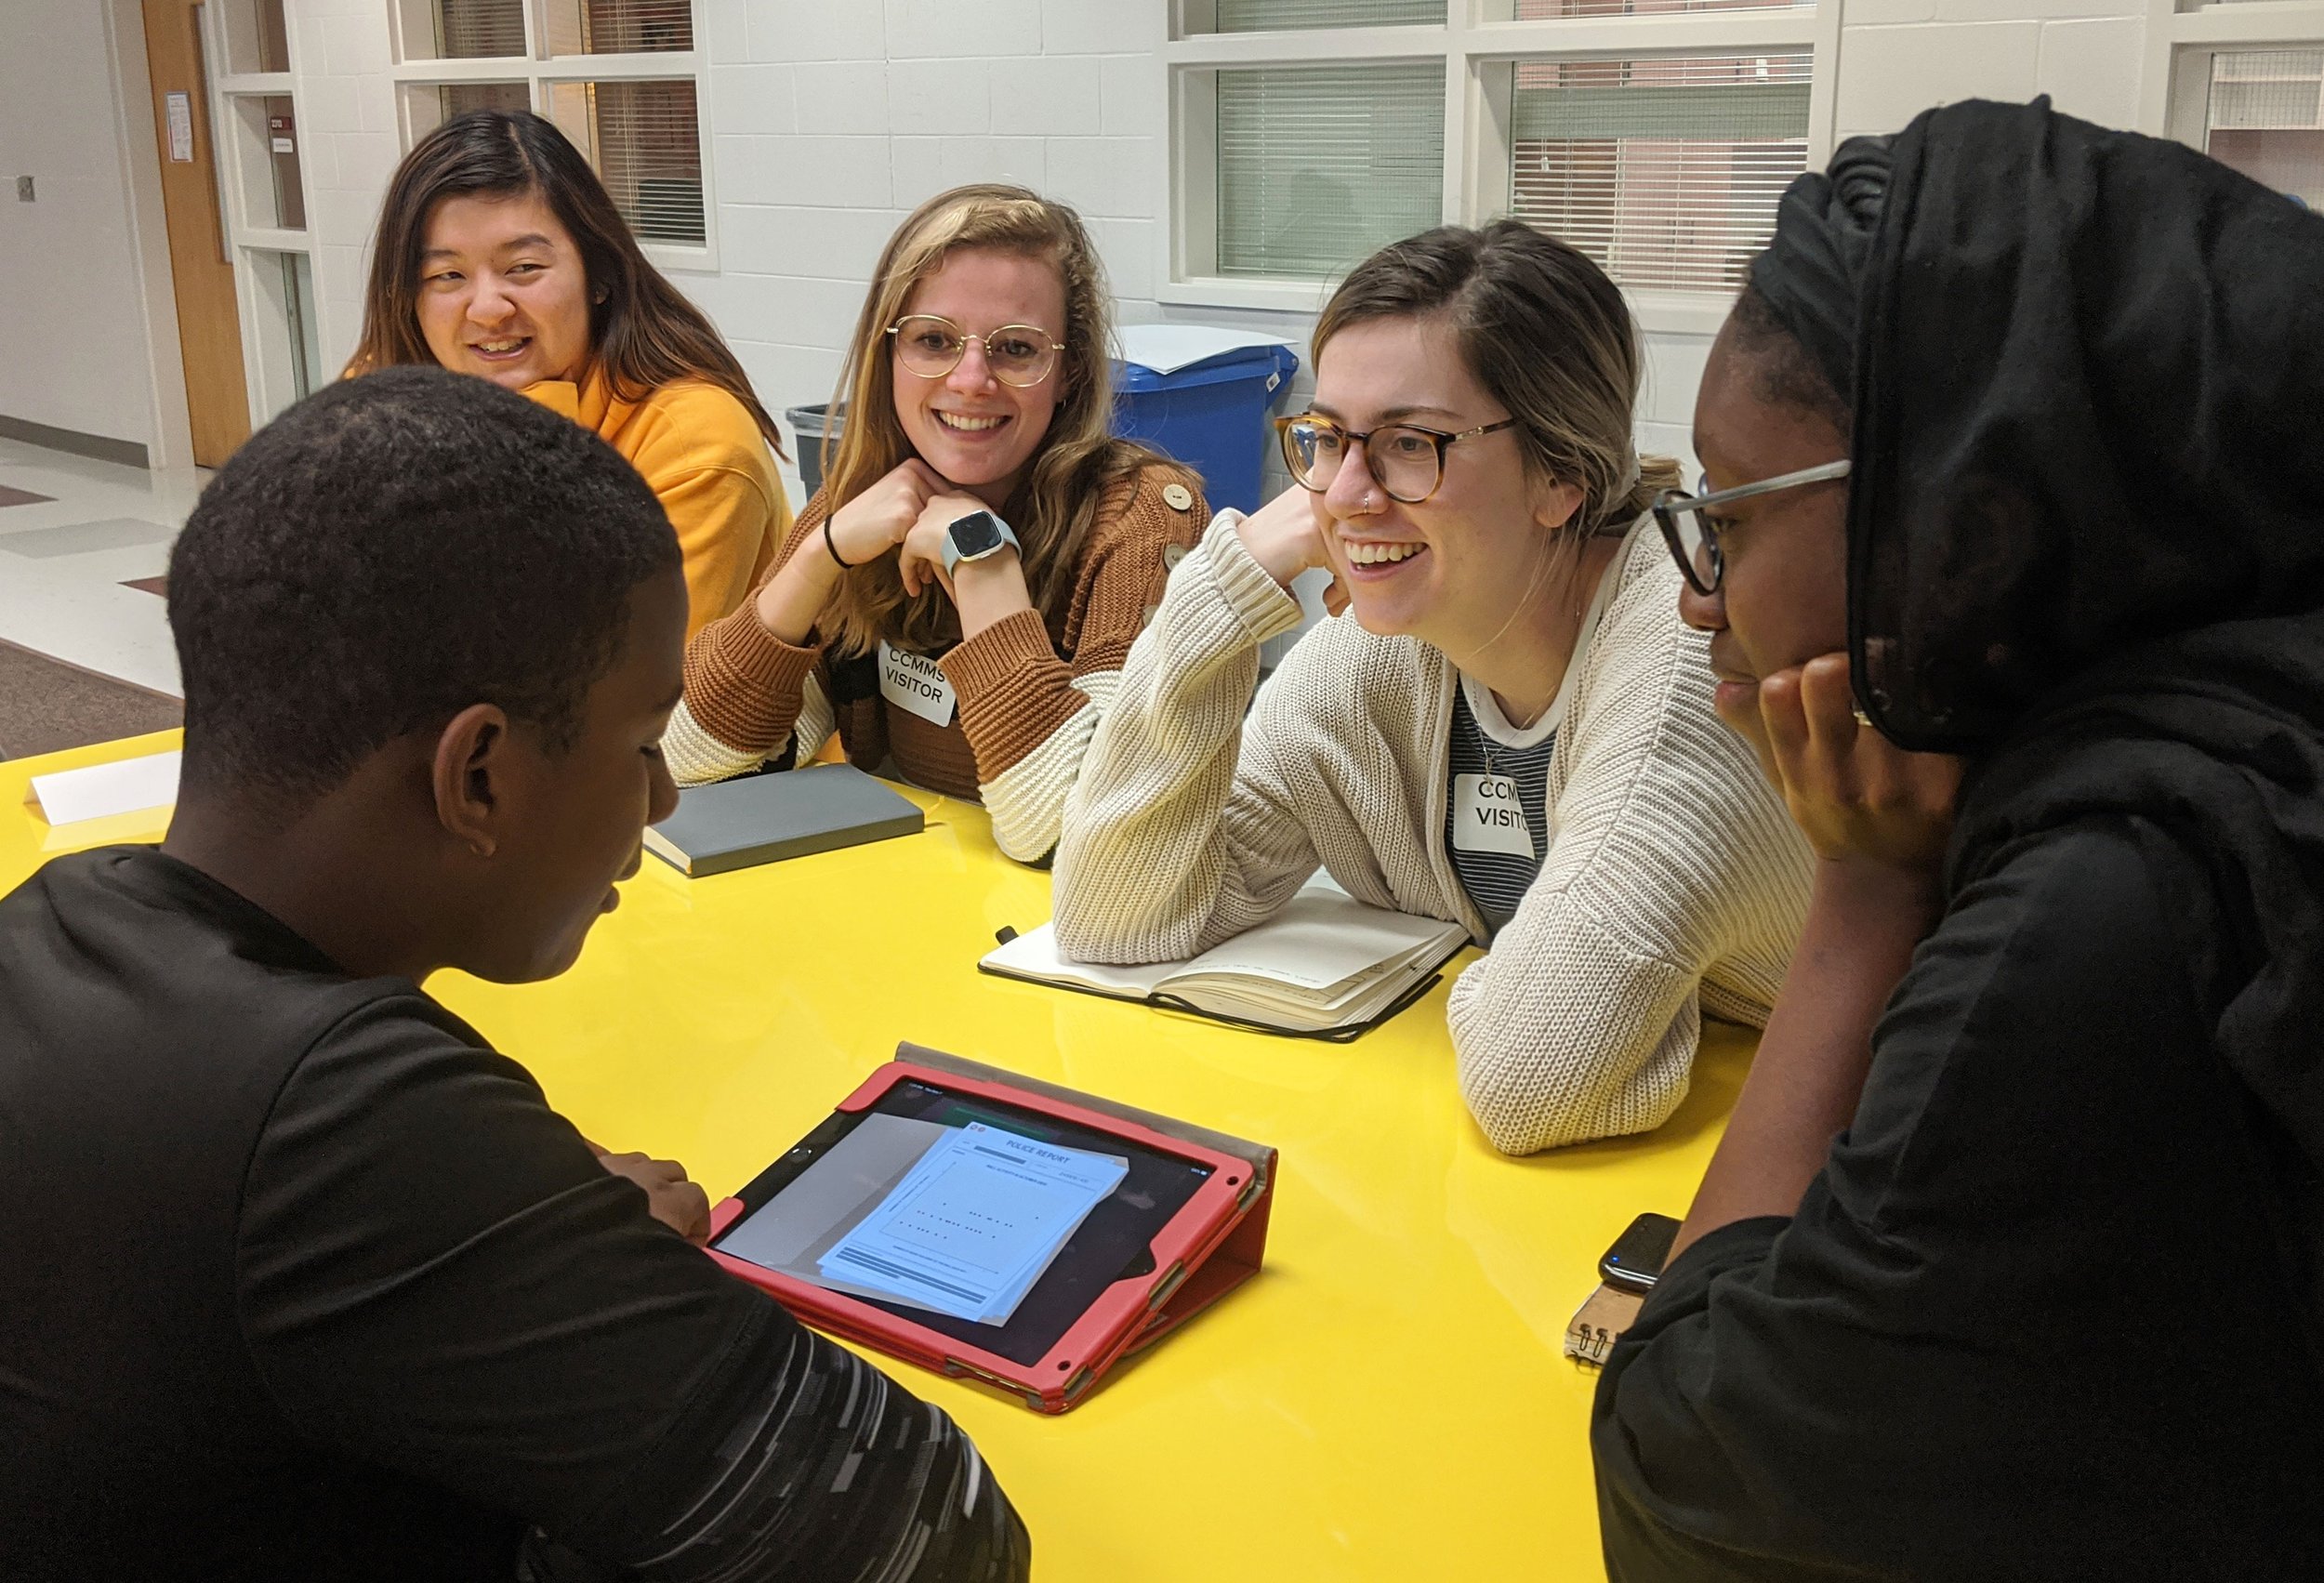
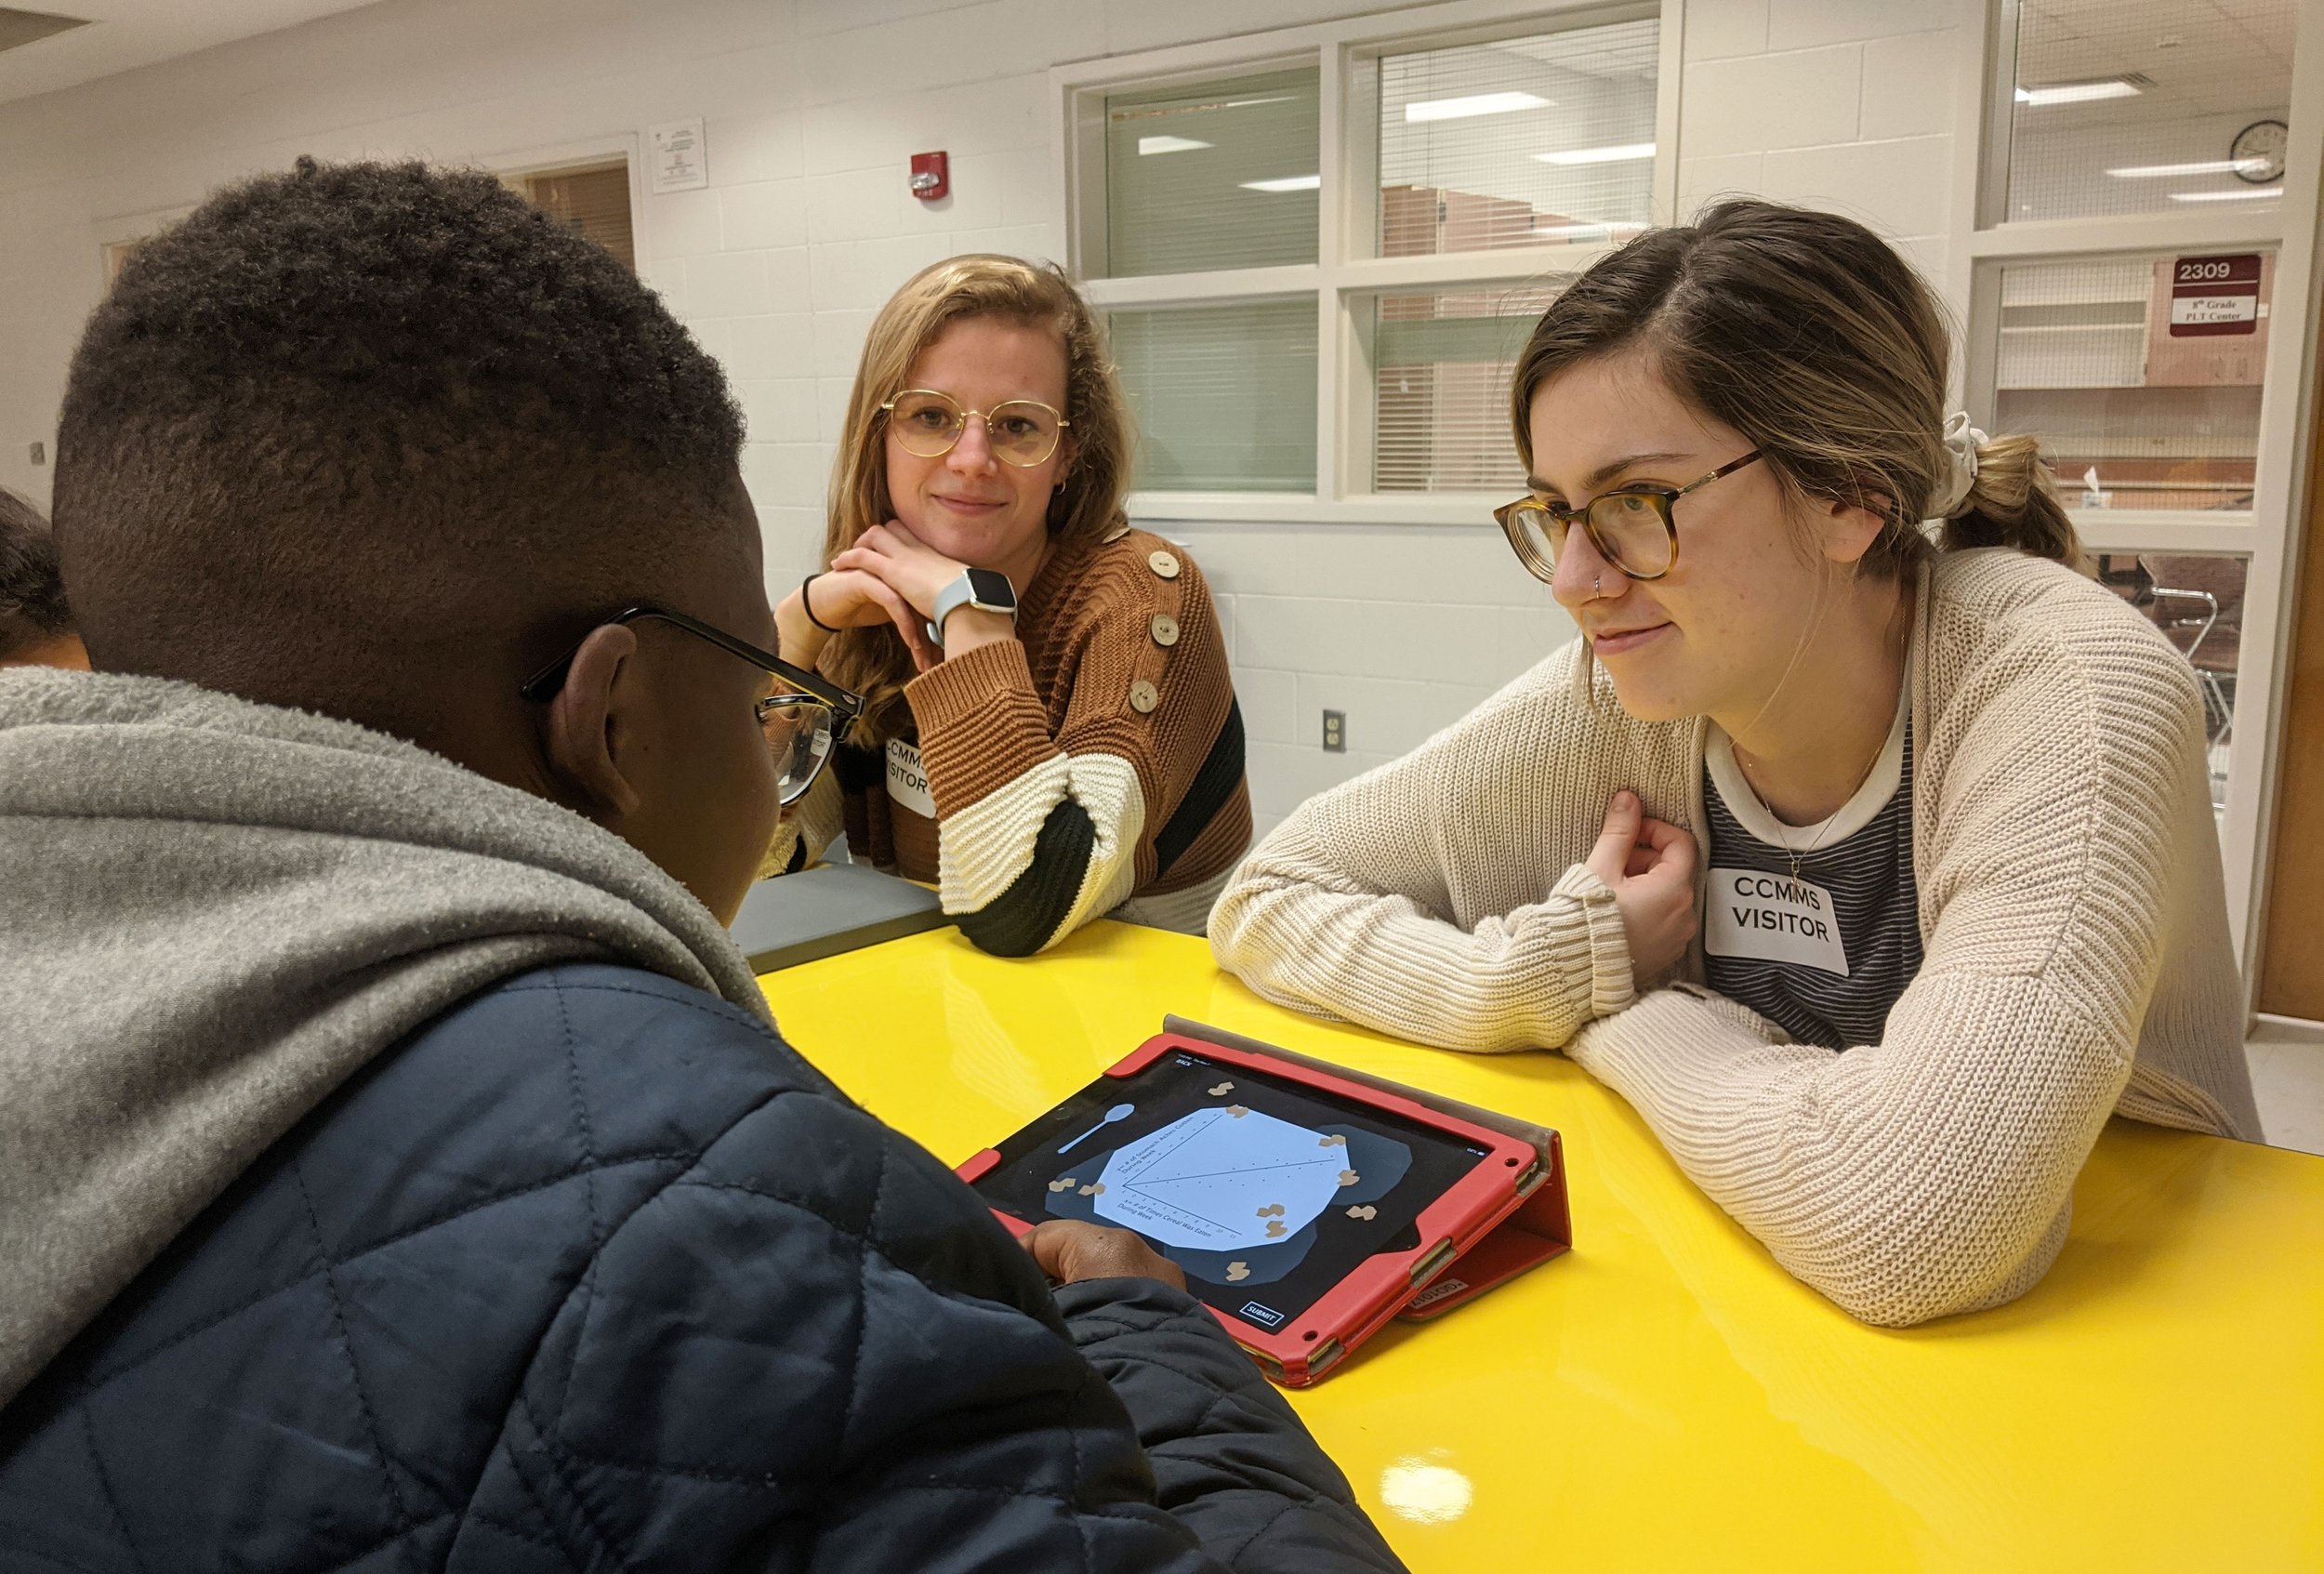
We created two different storylines the students could choose from and built a prototype they could work through. After refining our prototype, we went to Centennial Middle School to test our tools with the students. The testing was very successful and allowed us to see how the kids react to and move through our tool, highlighting different pain points and areas for improvement. The students all seemed to enjoy playing the game and were able to successfully work through the problem.

StoryTime Prototype
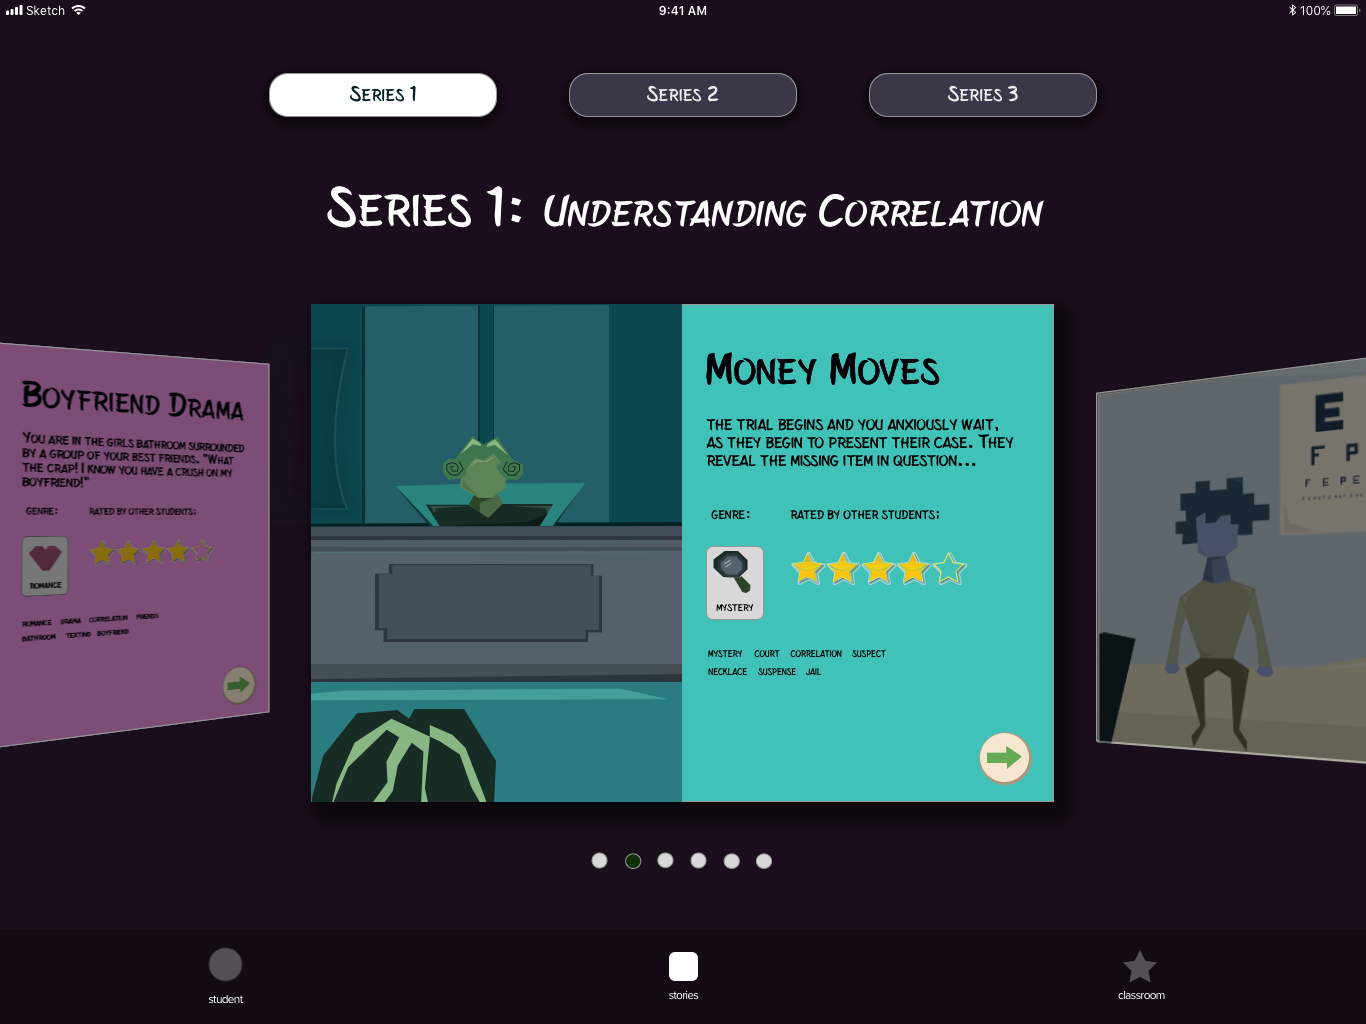
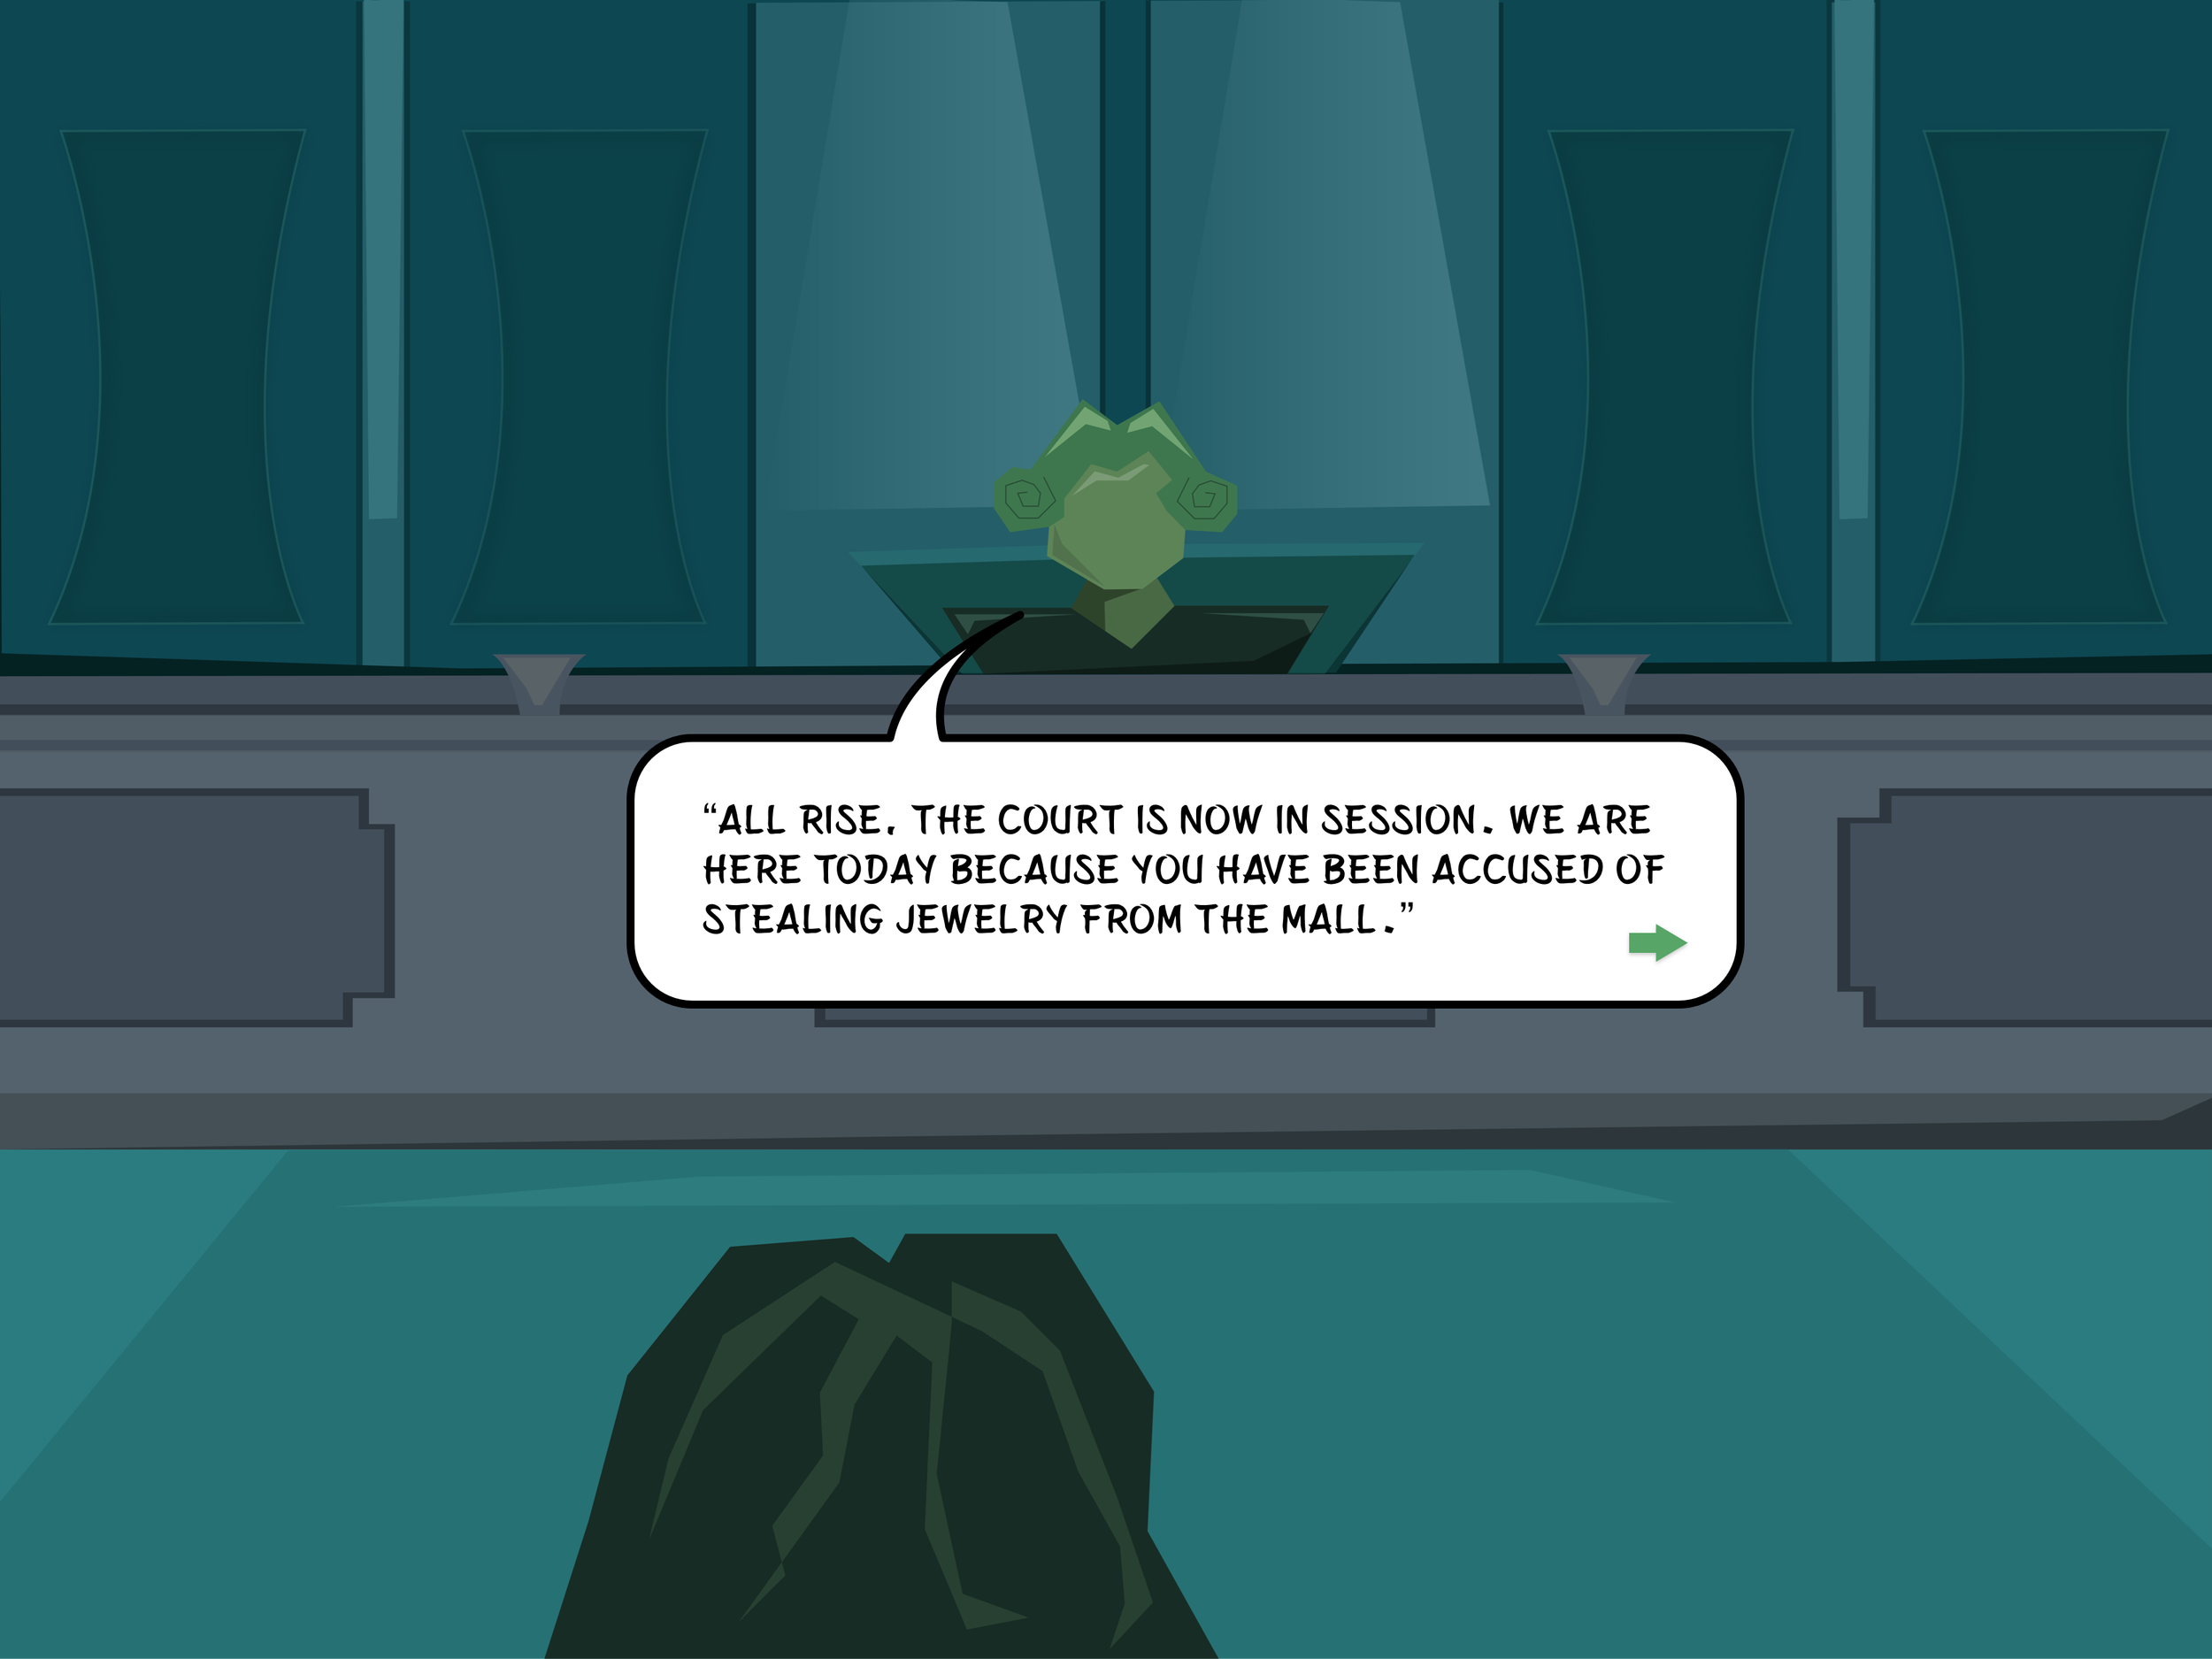
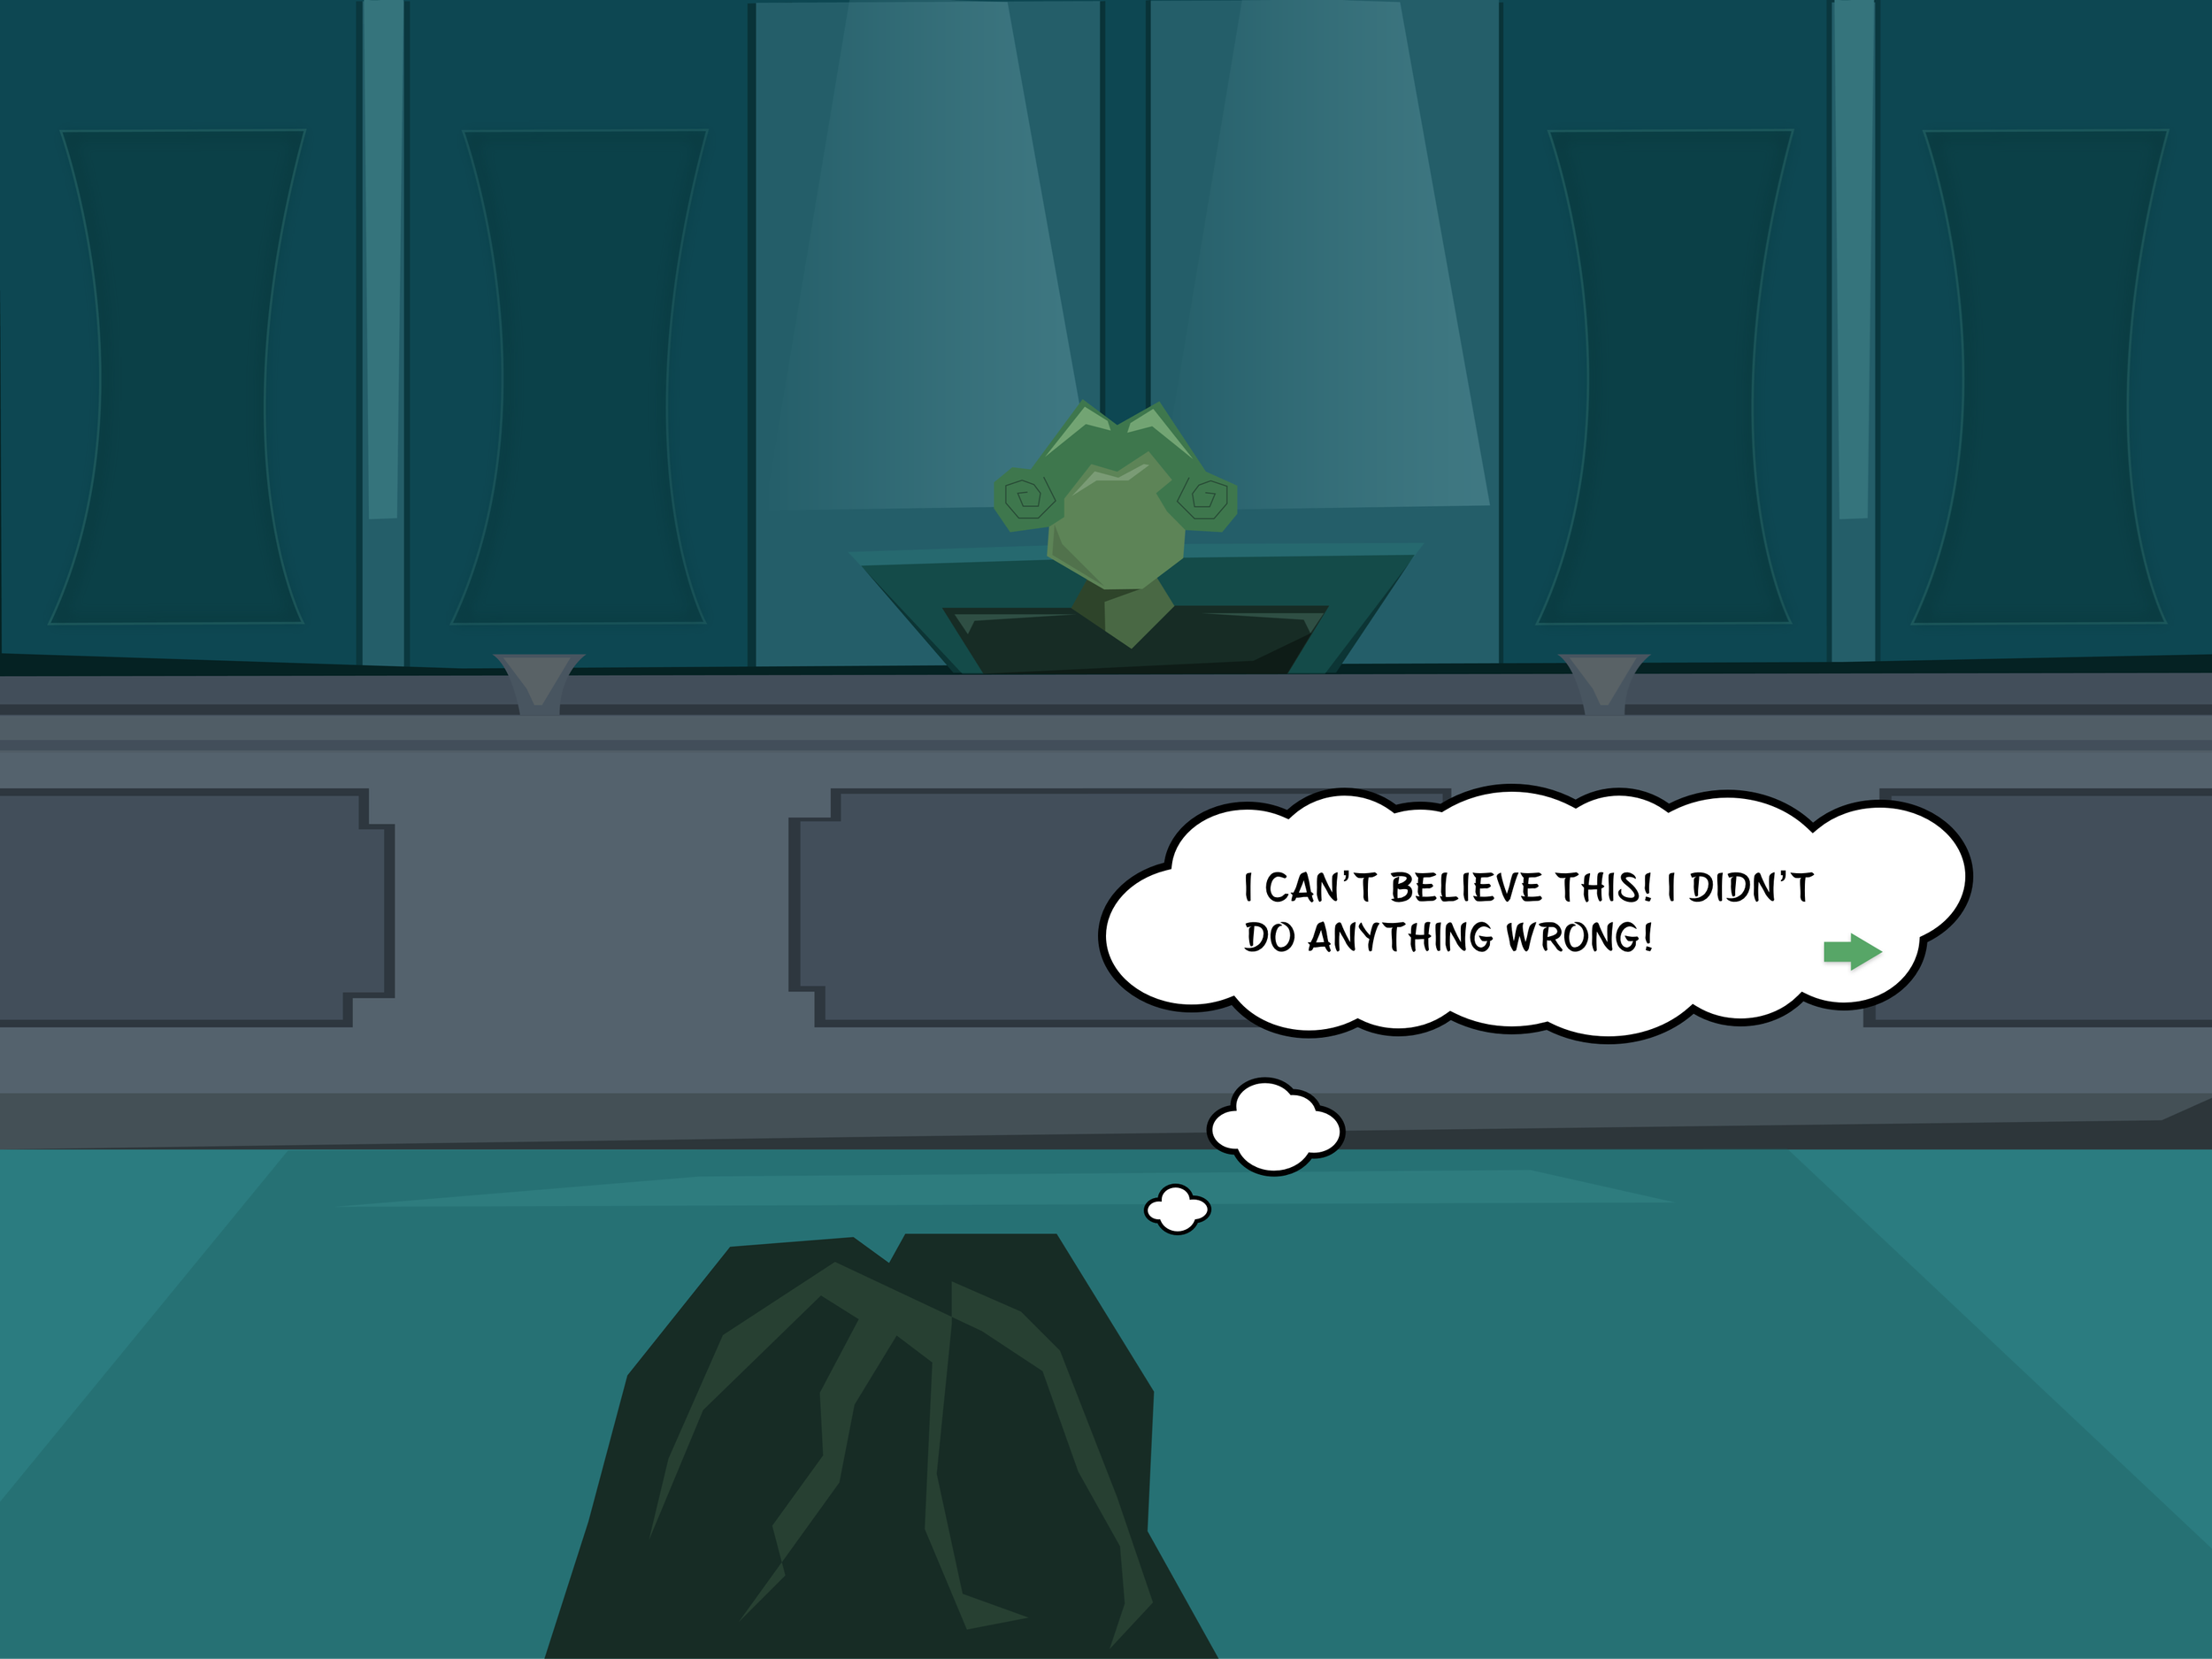
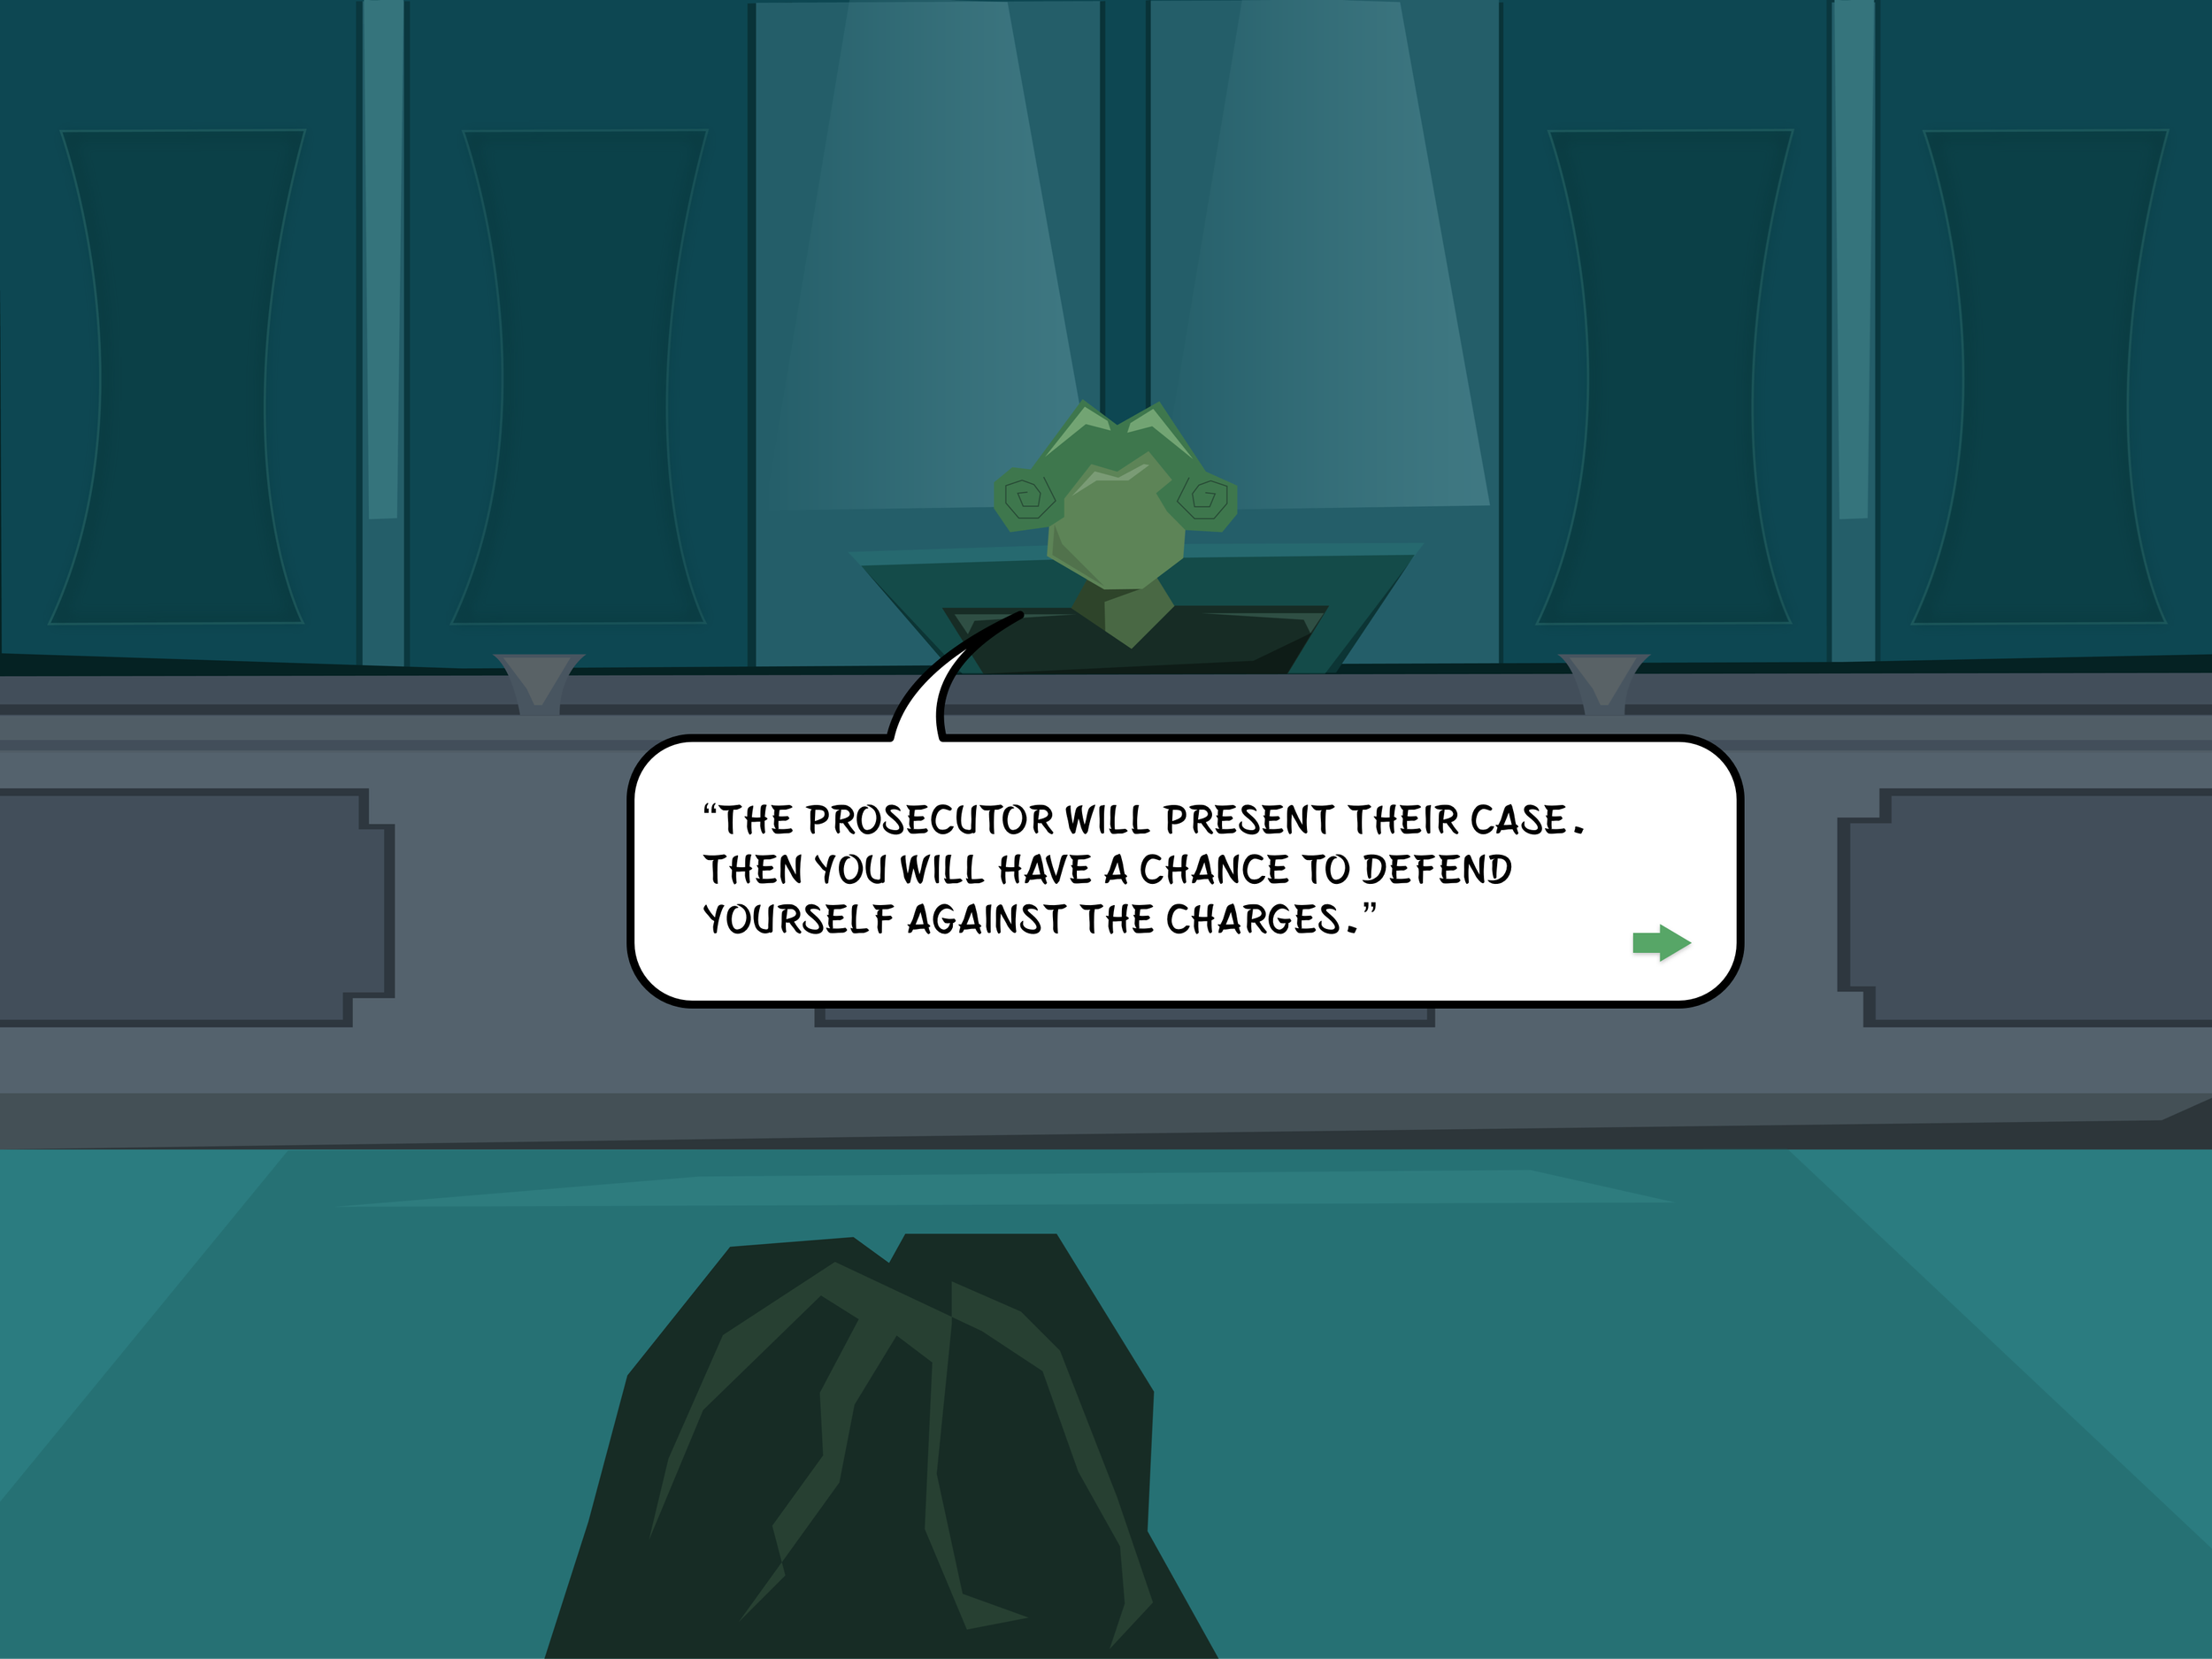
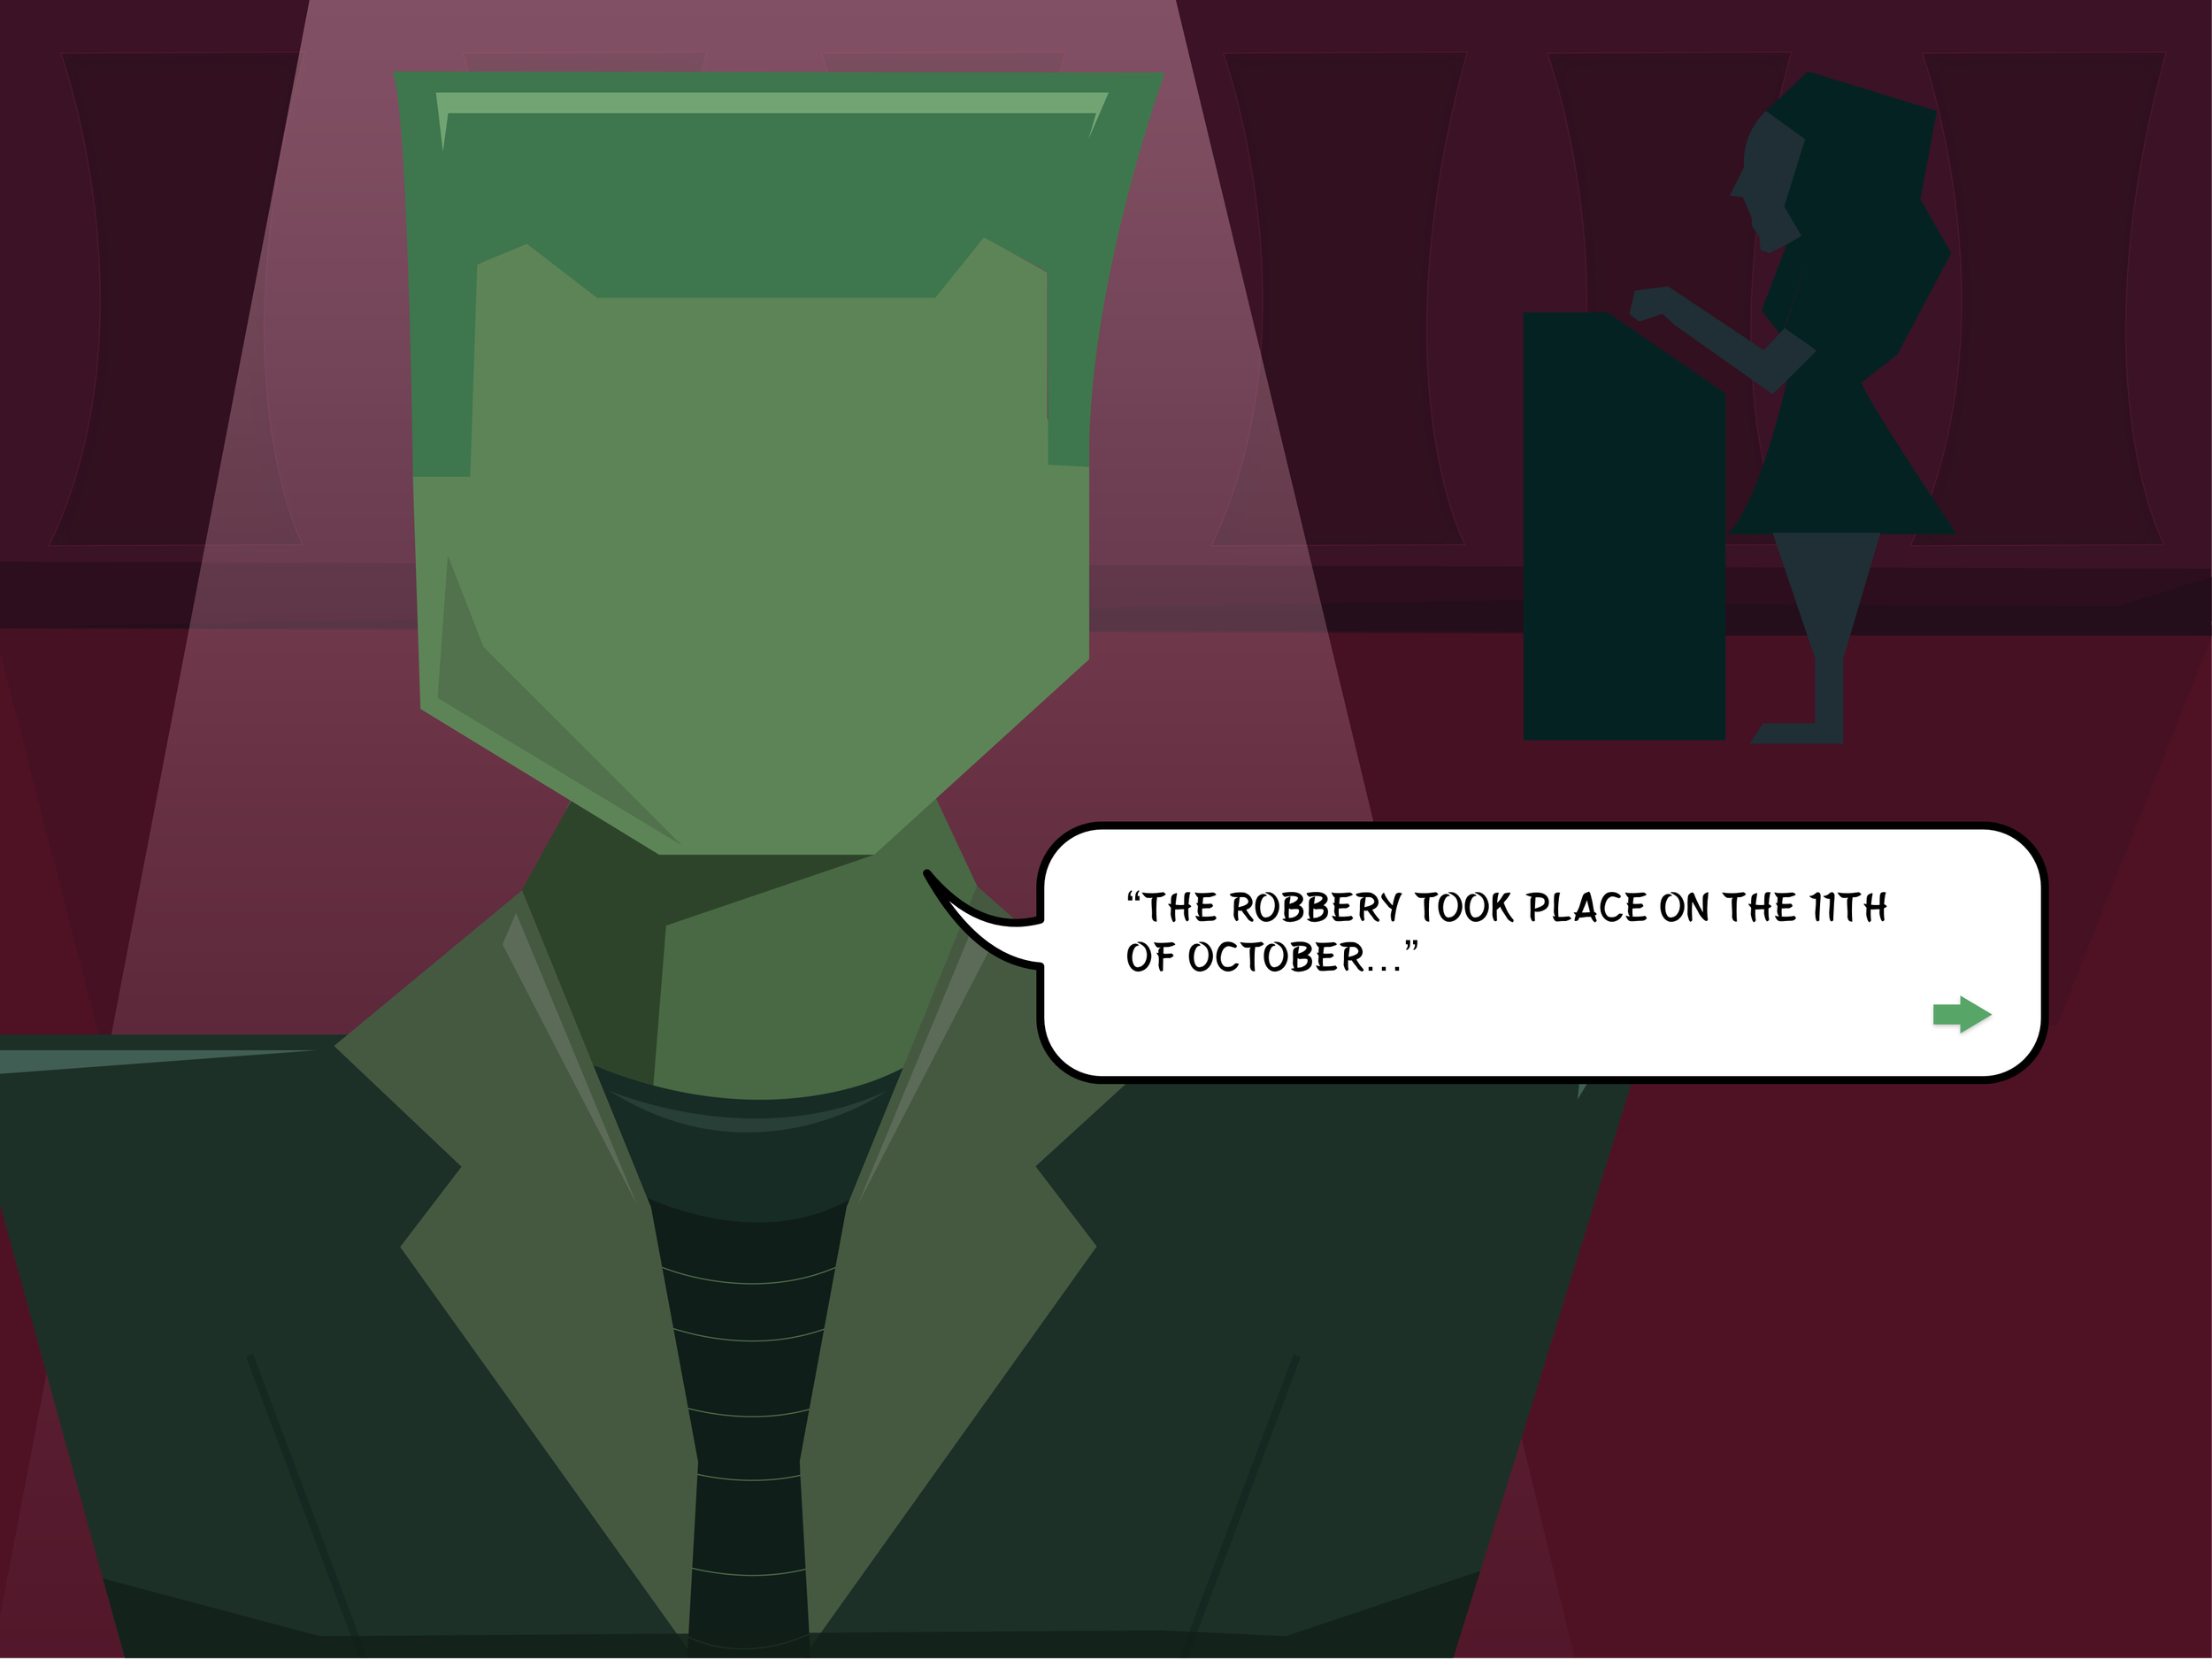
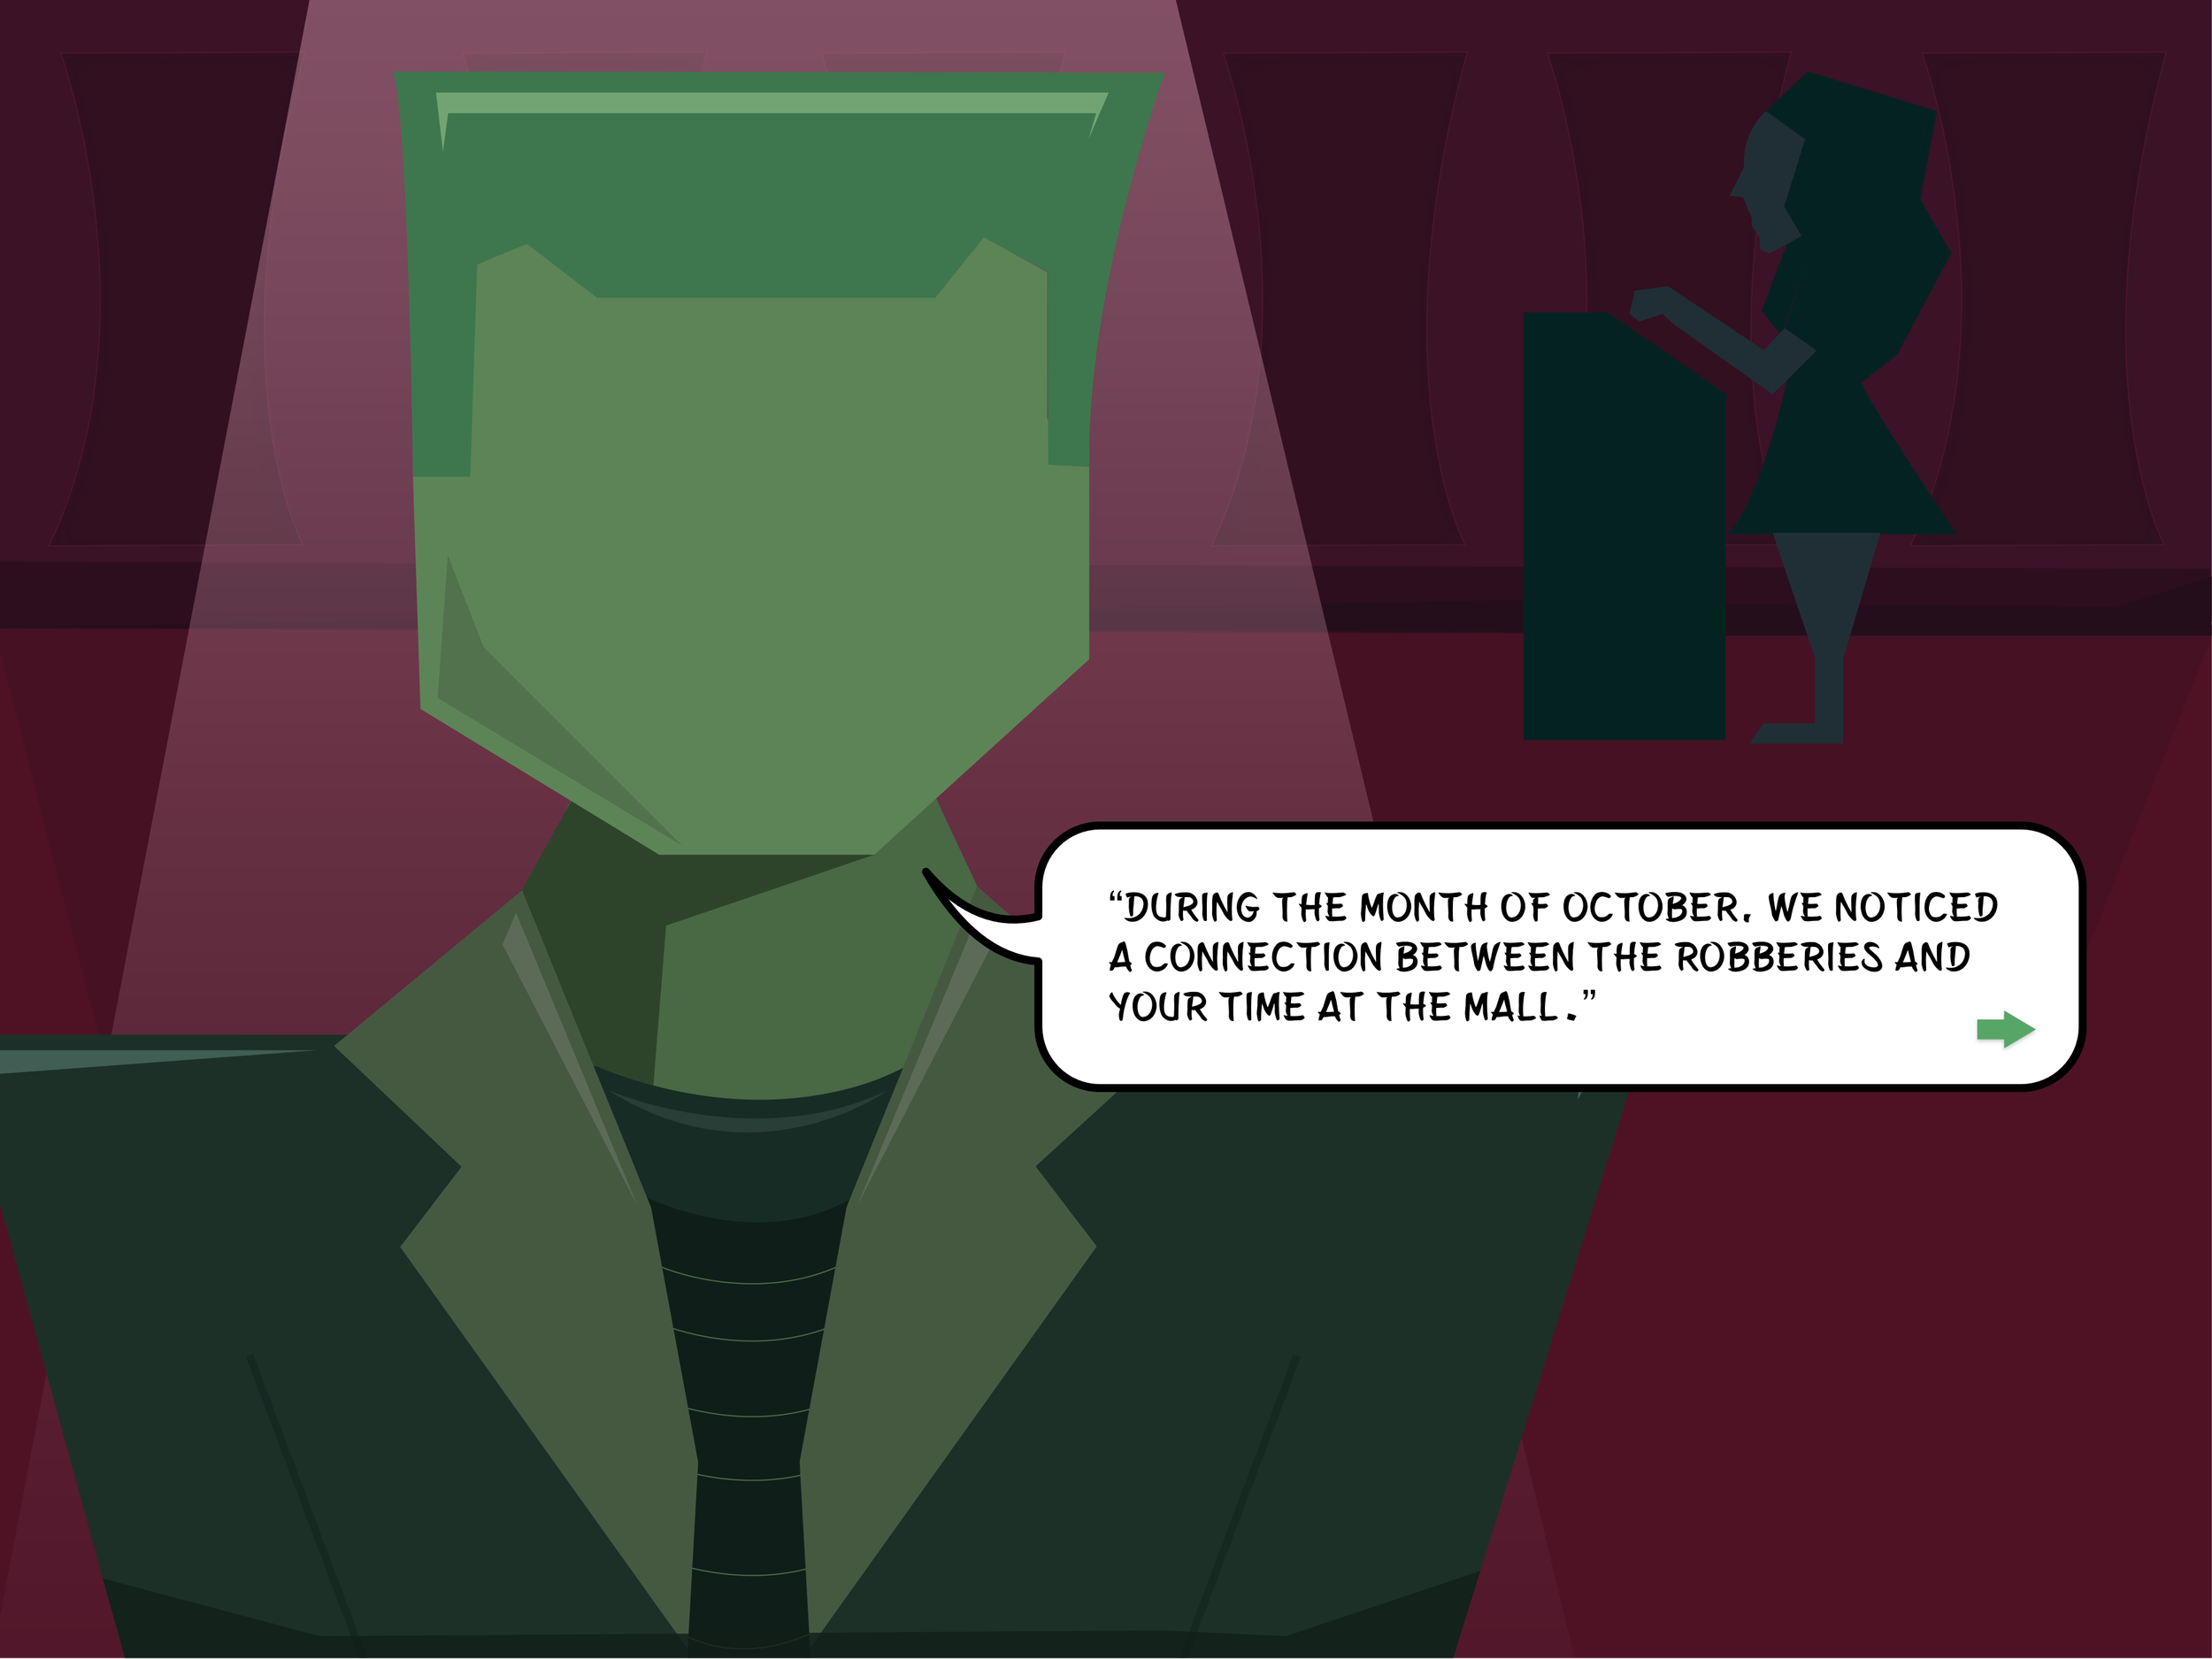
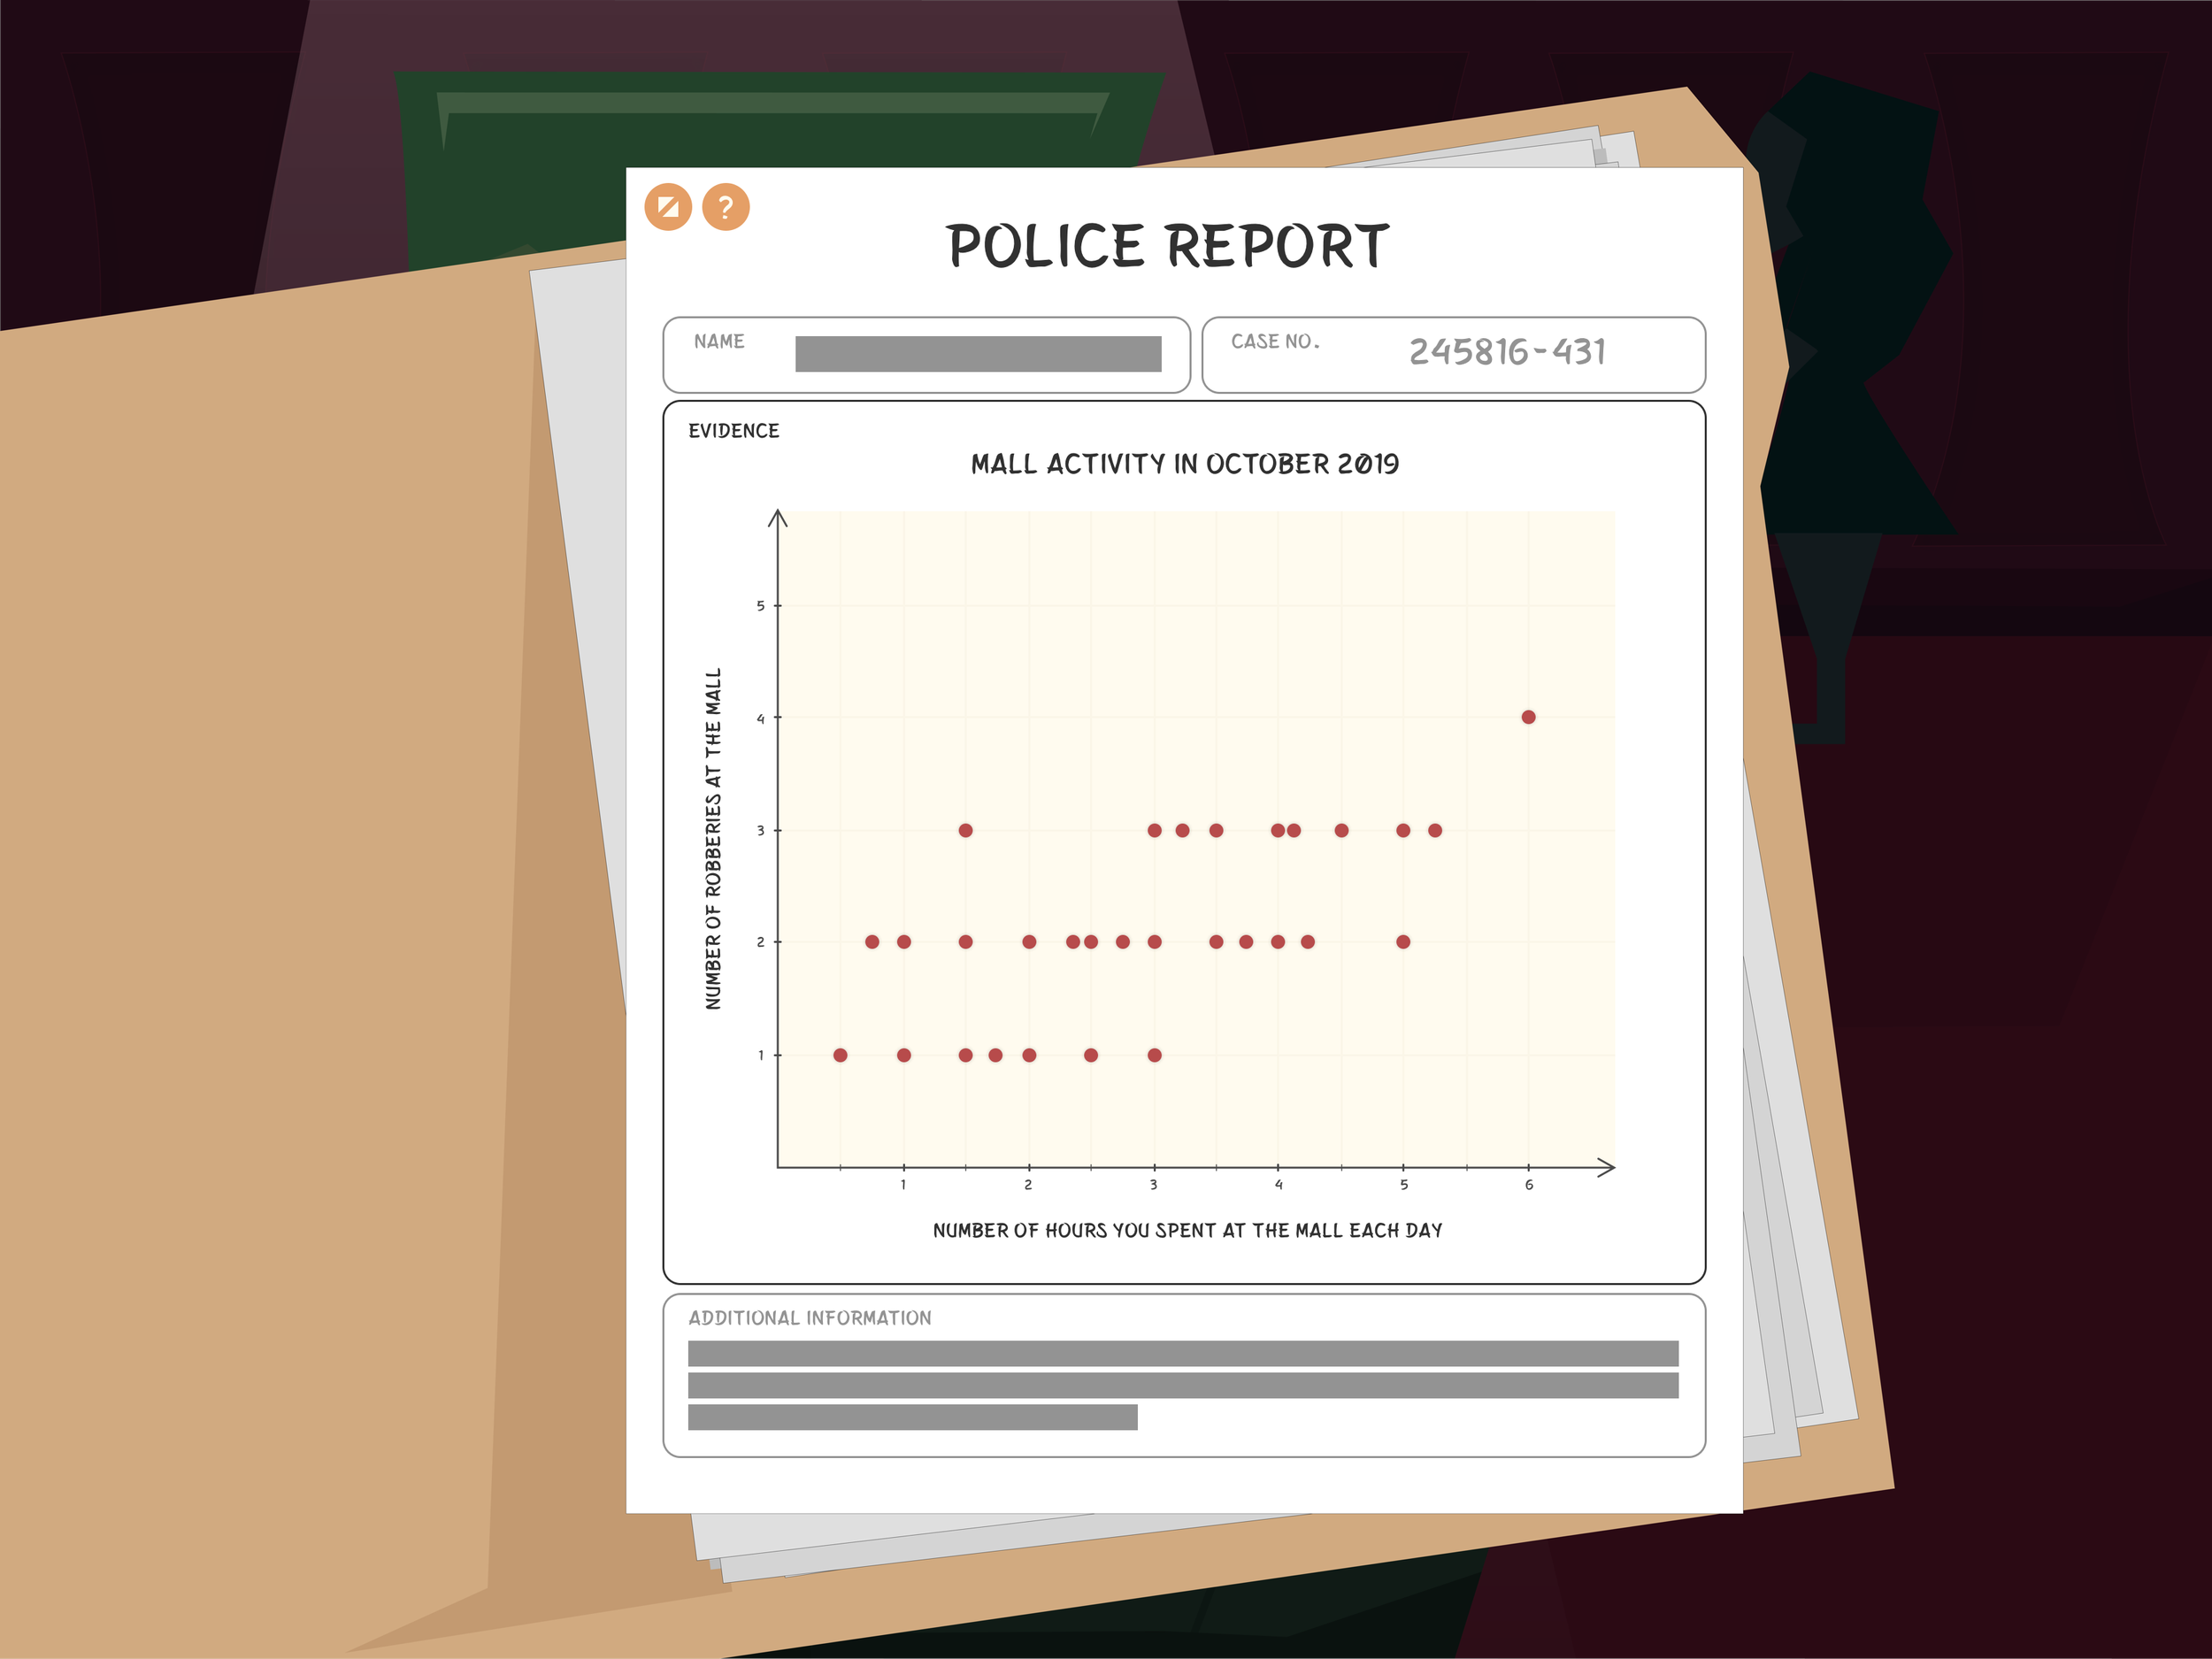
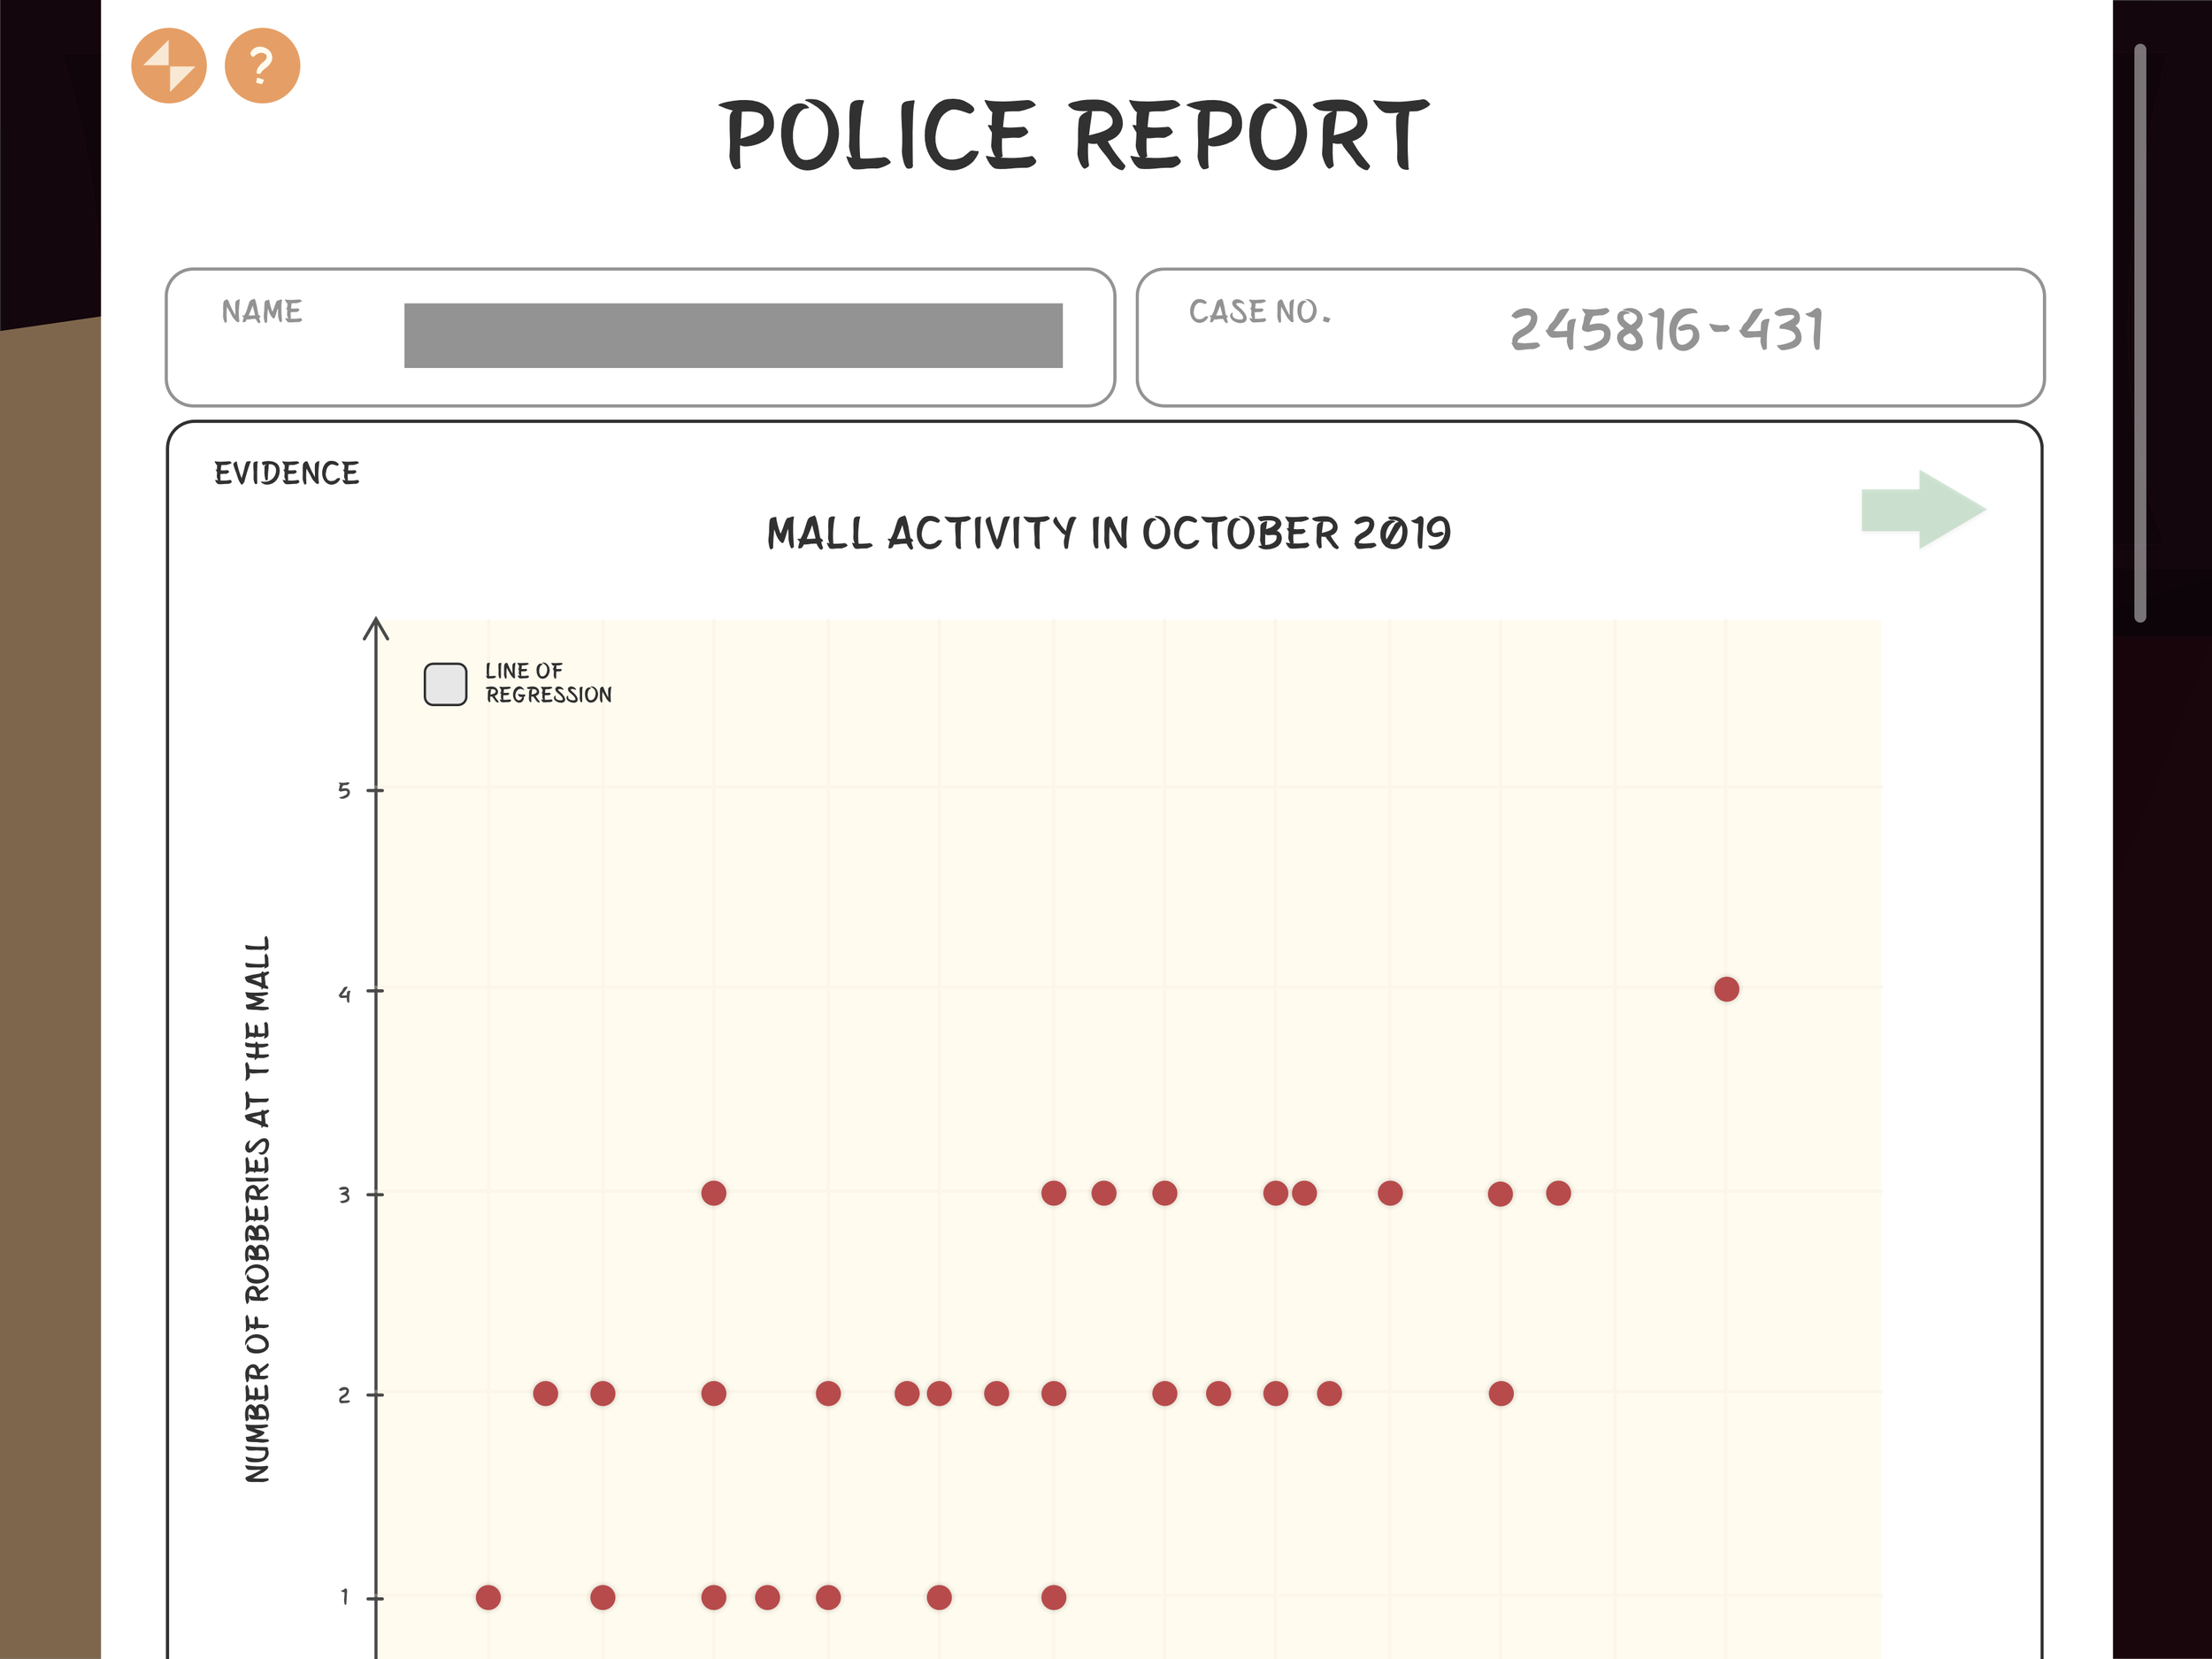
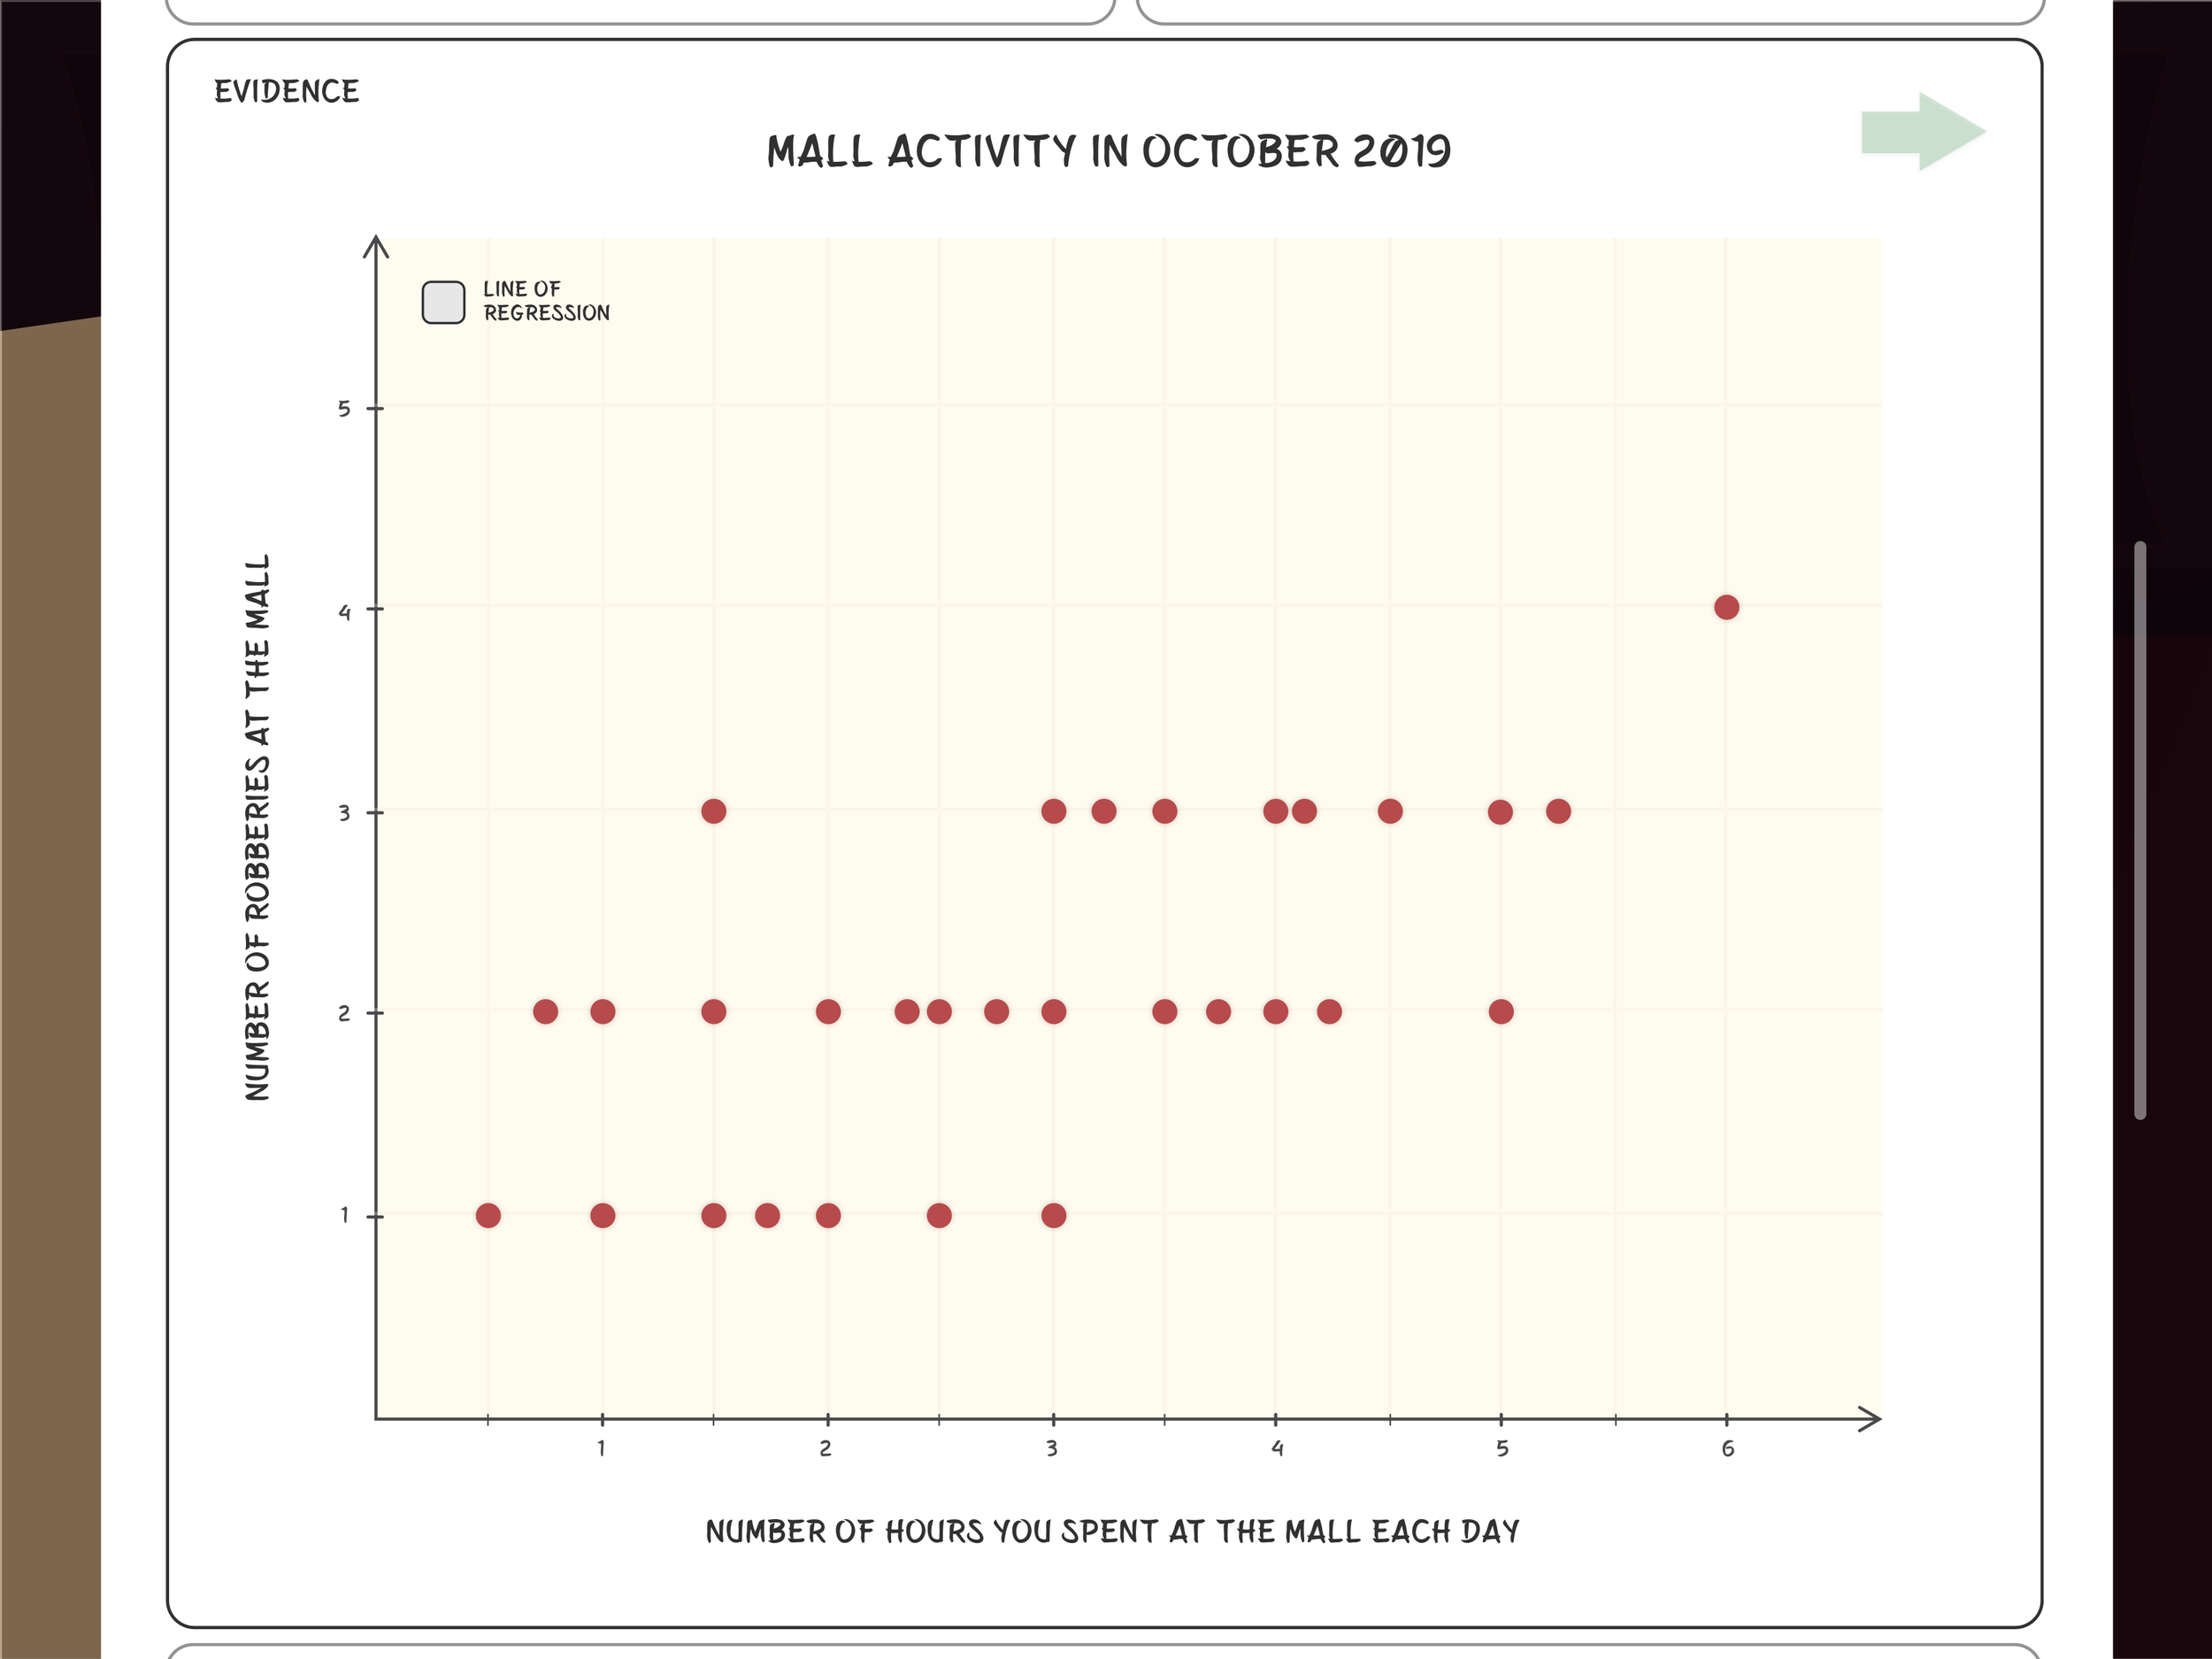
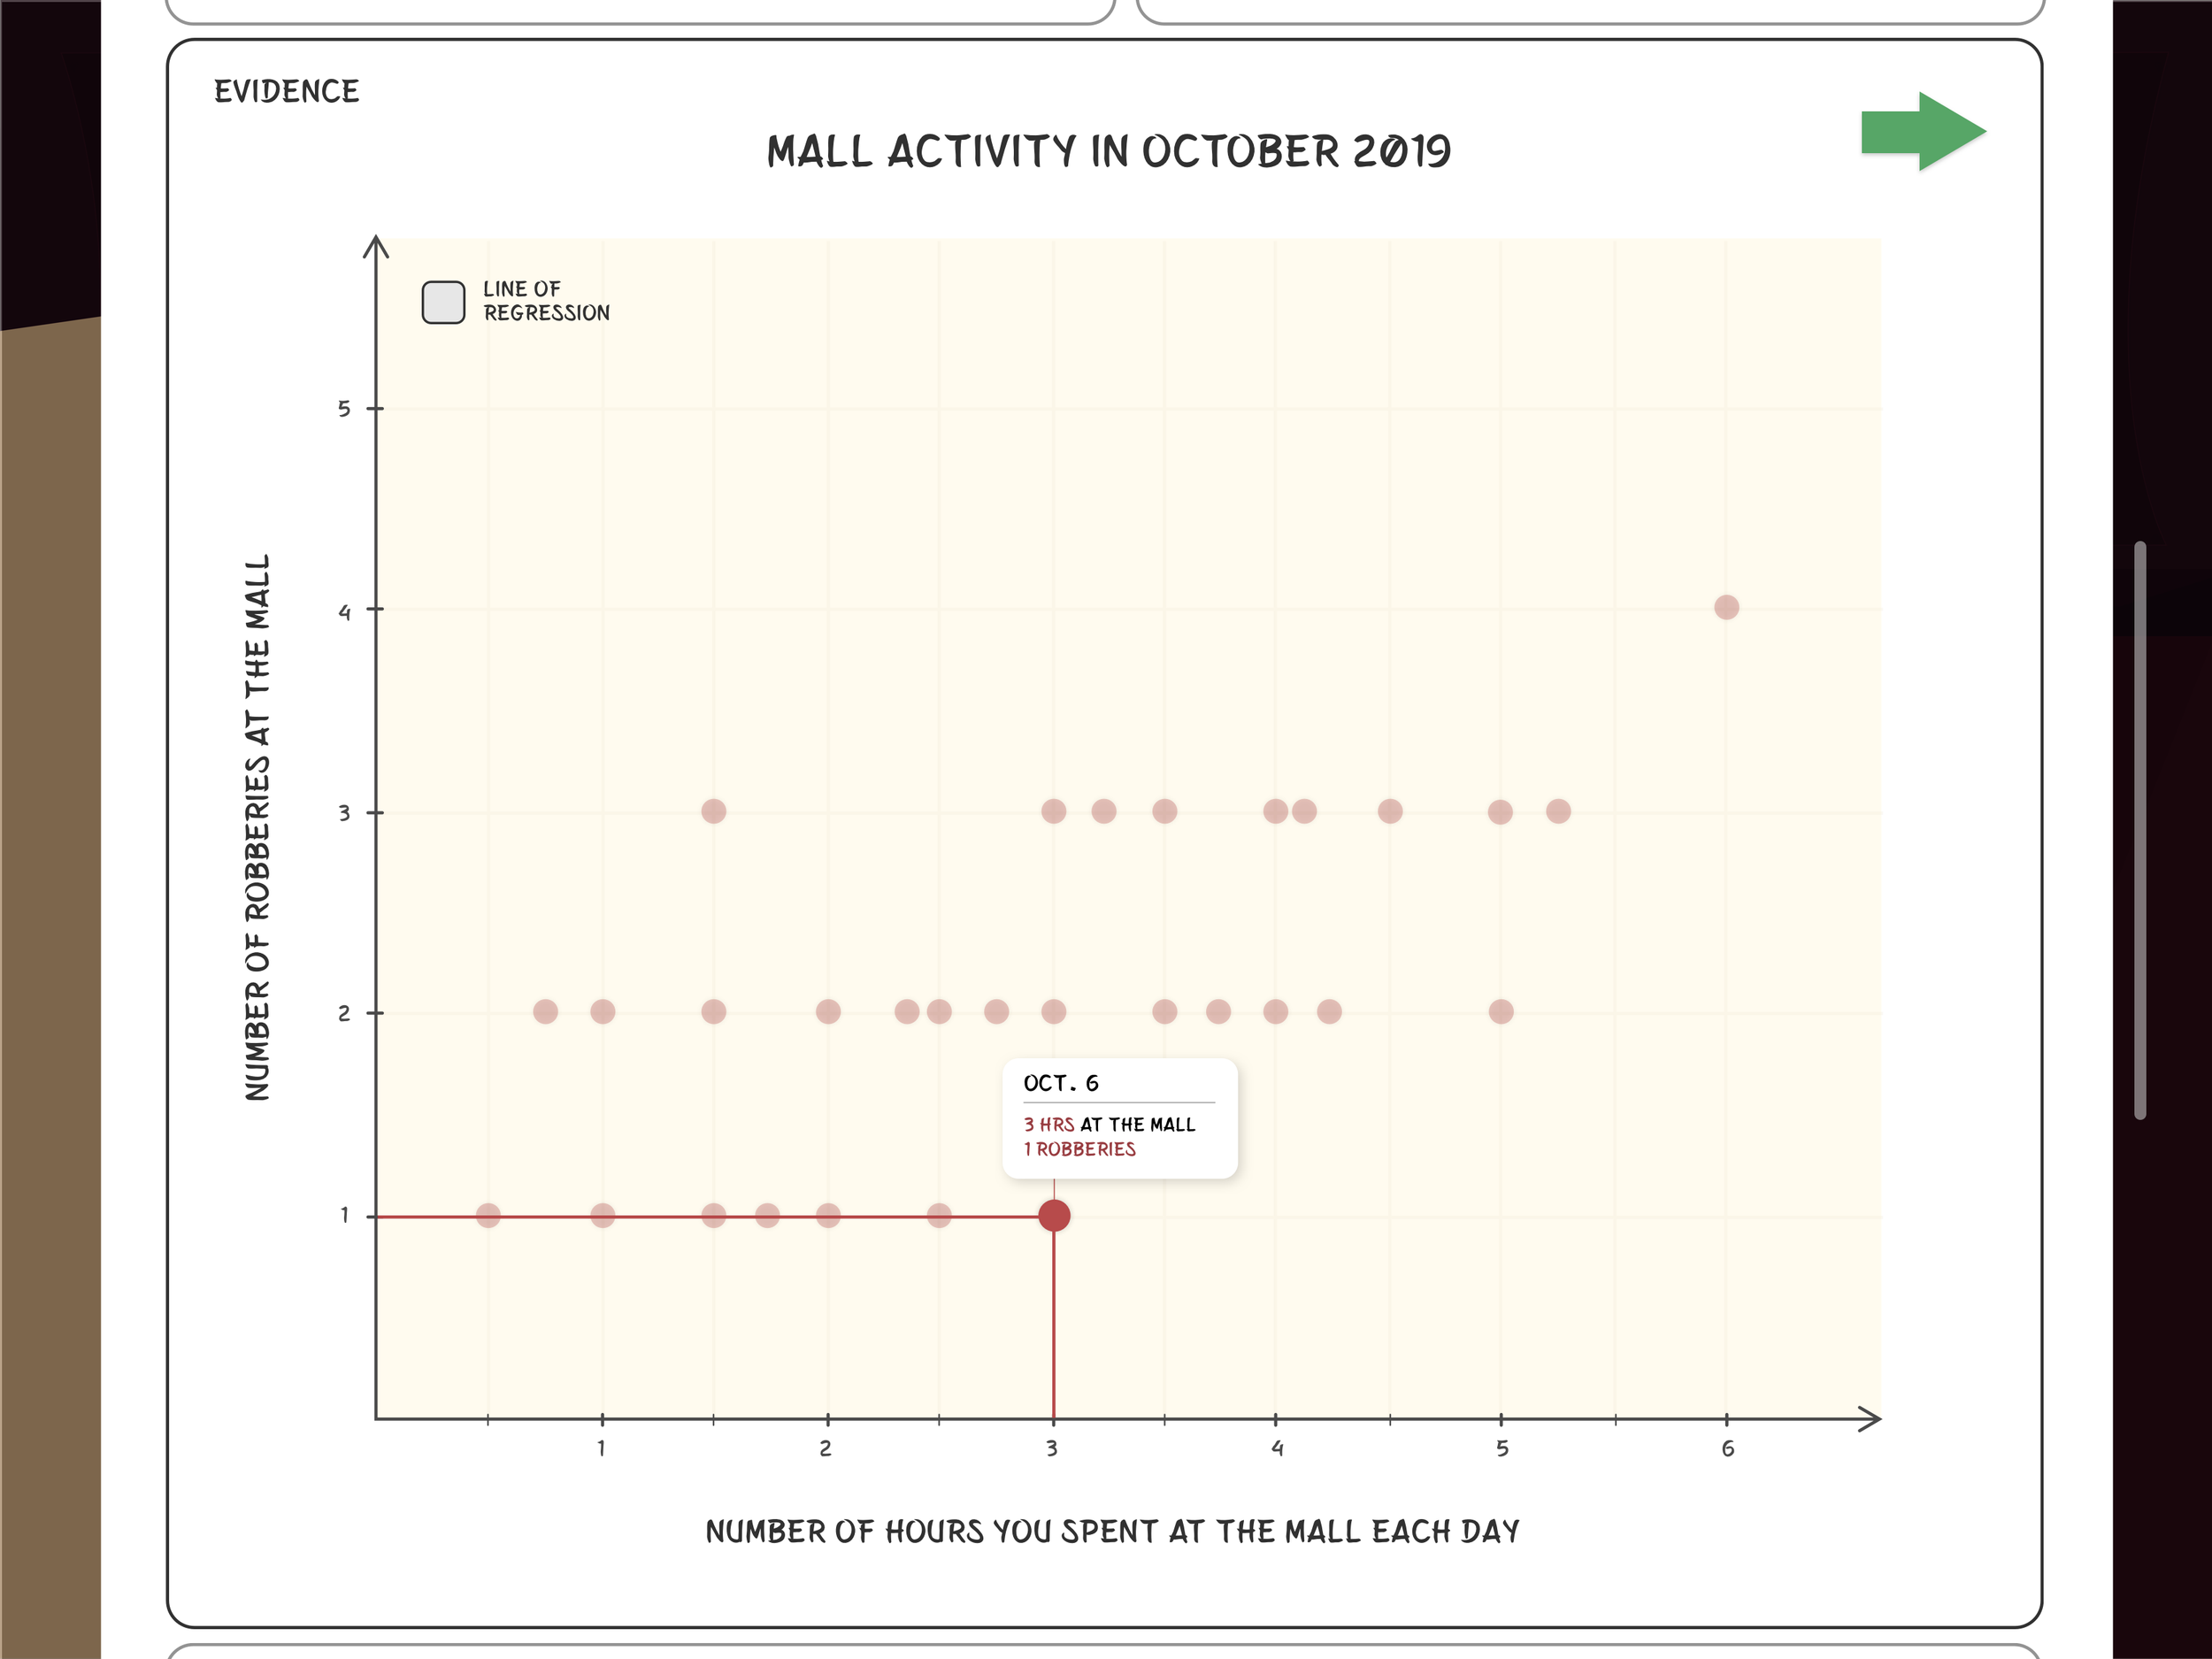
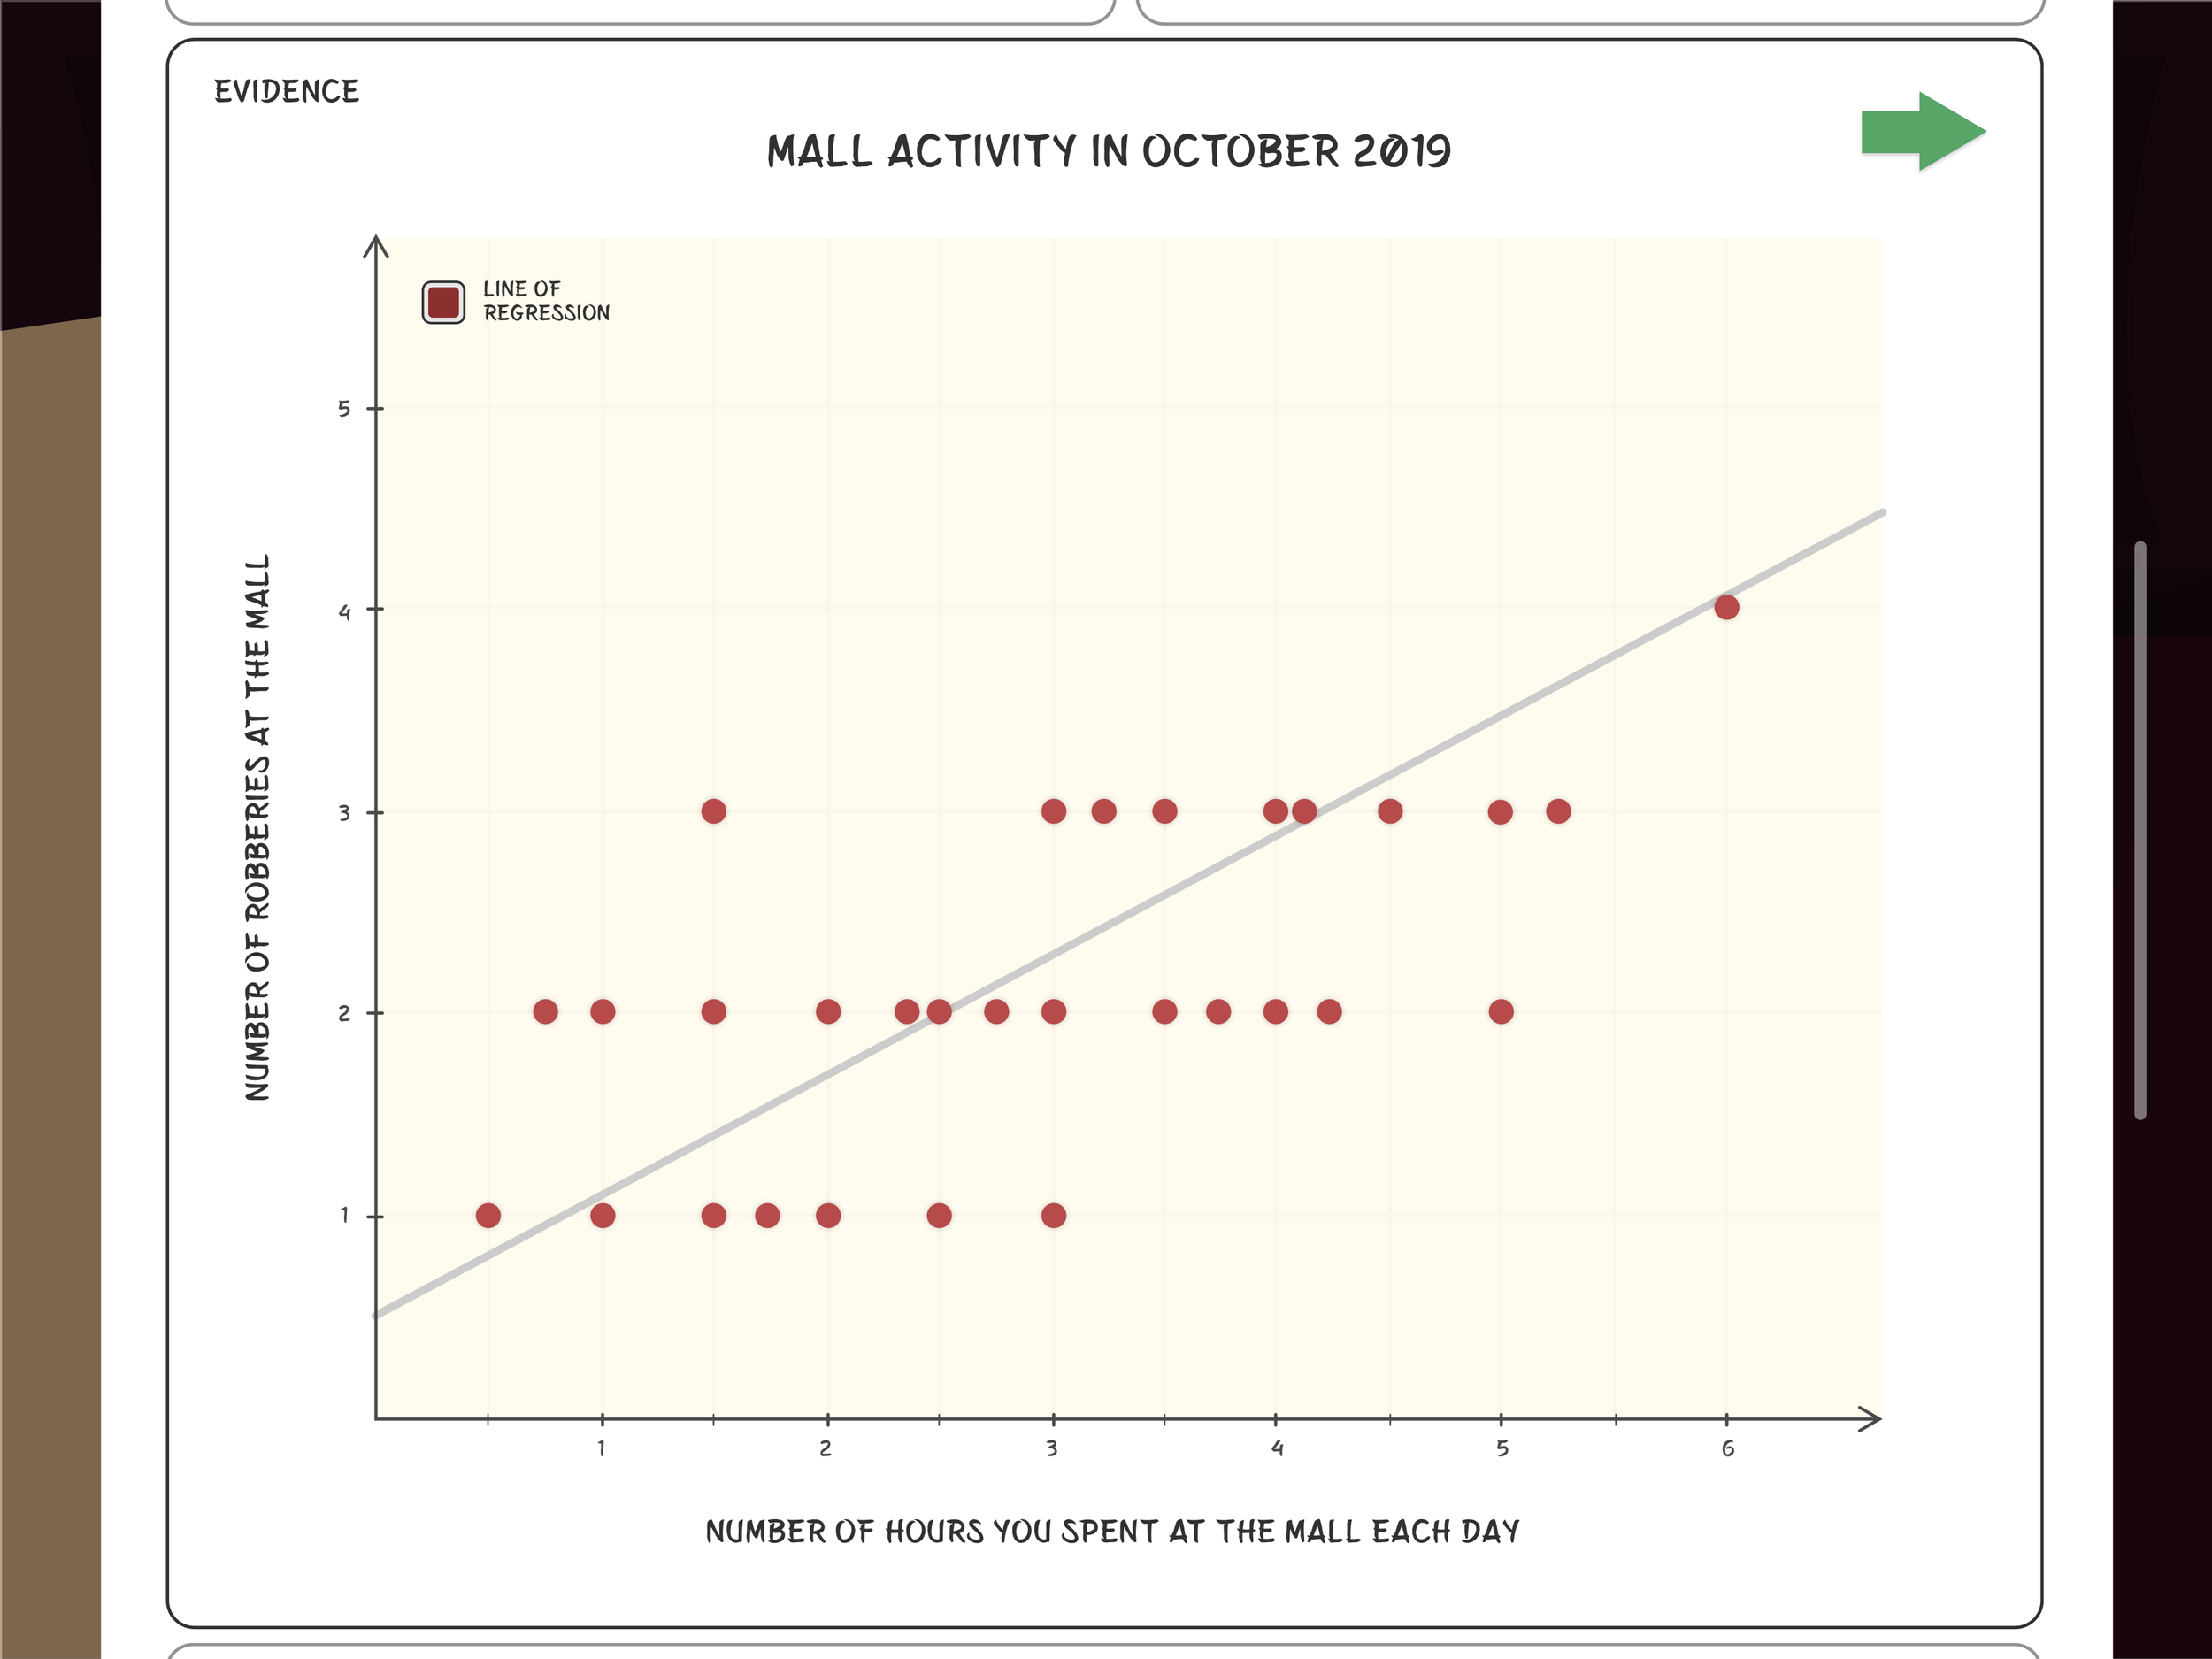
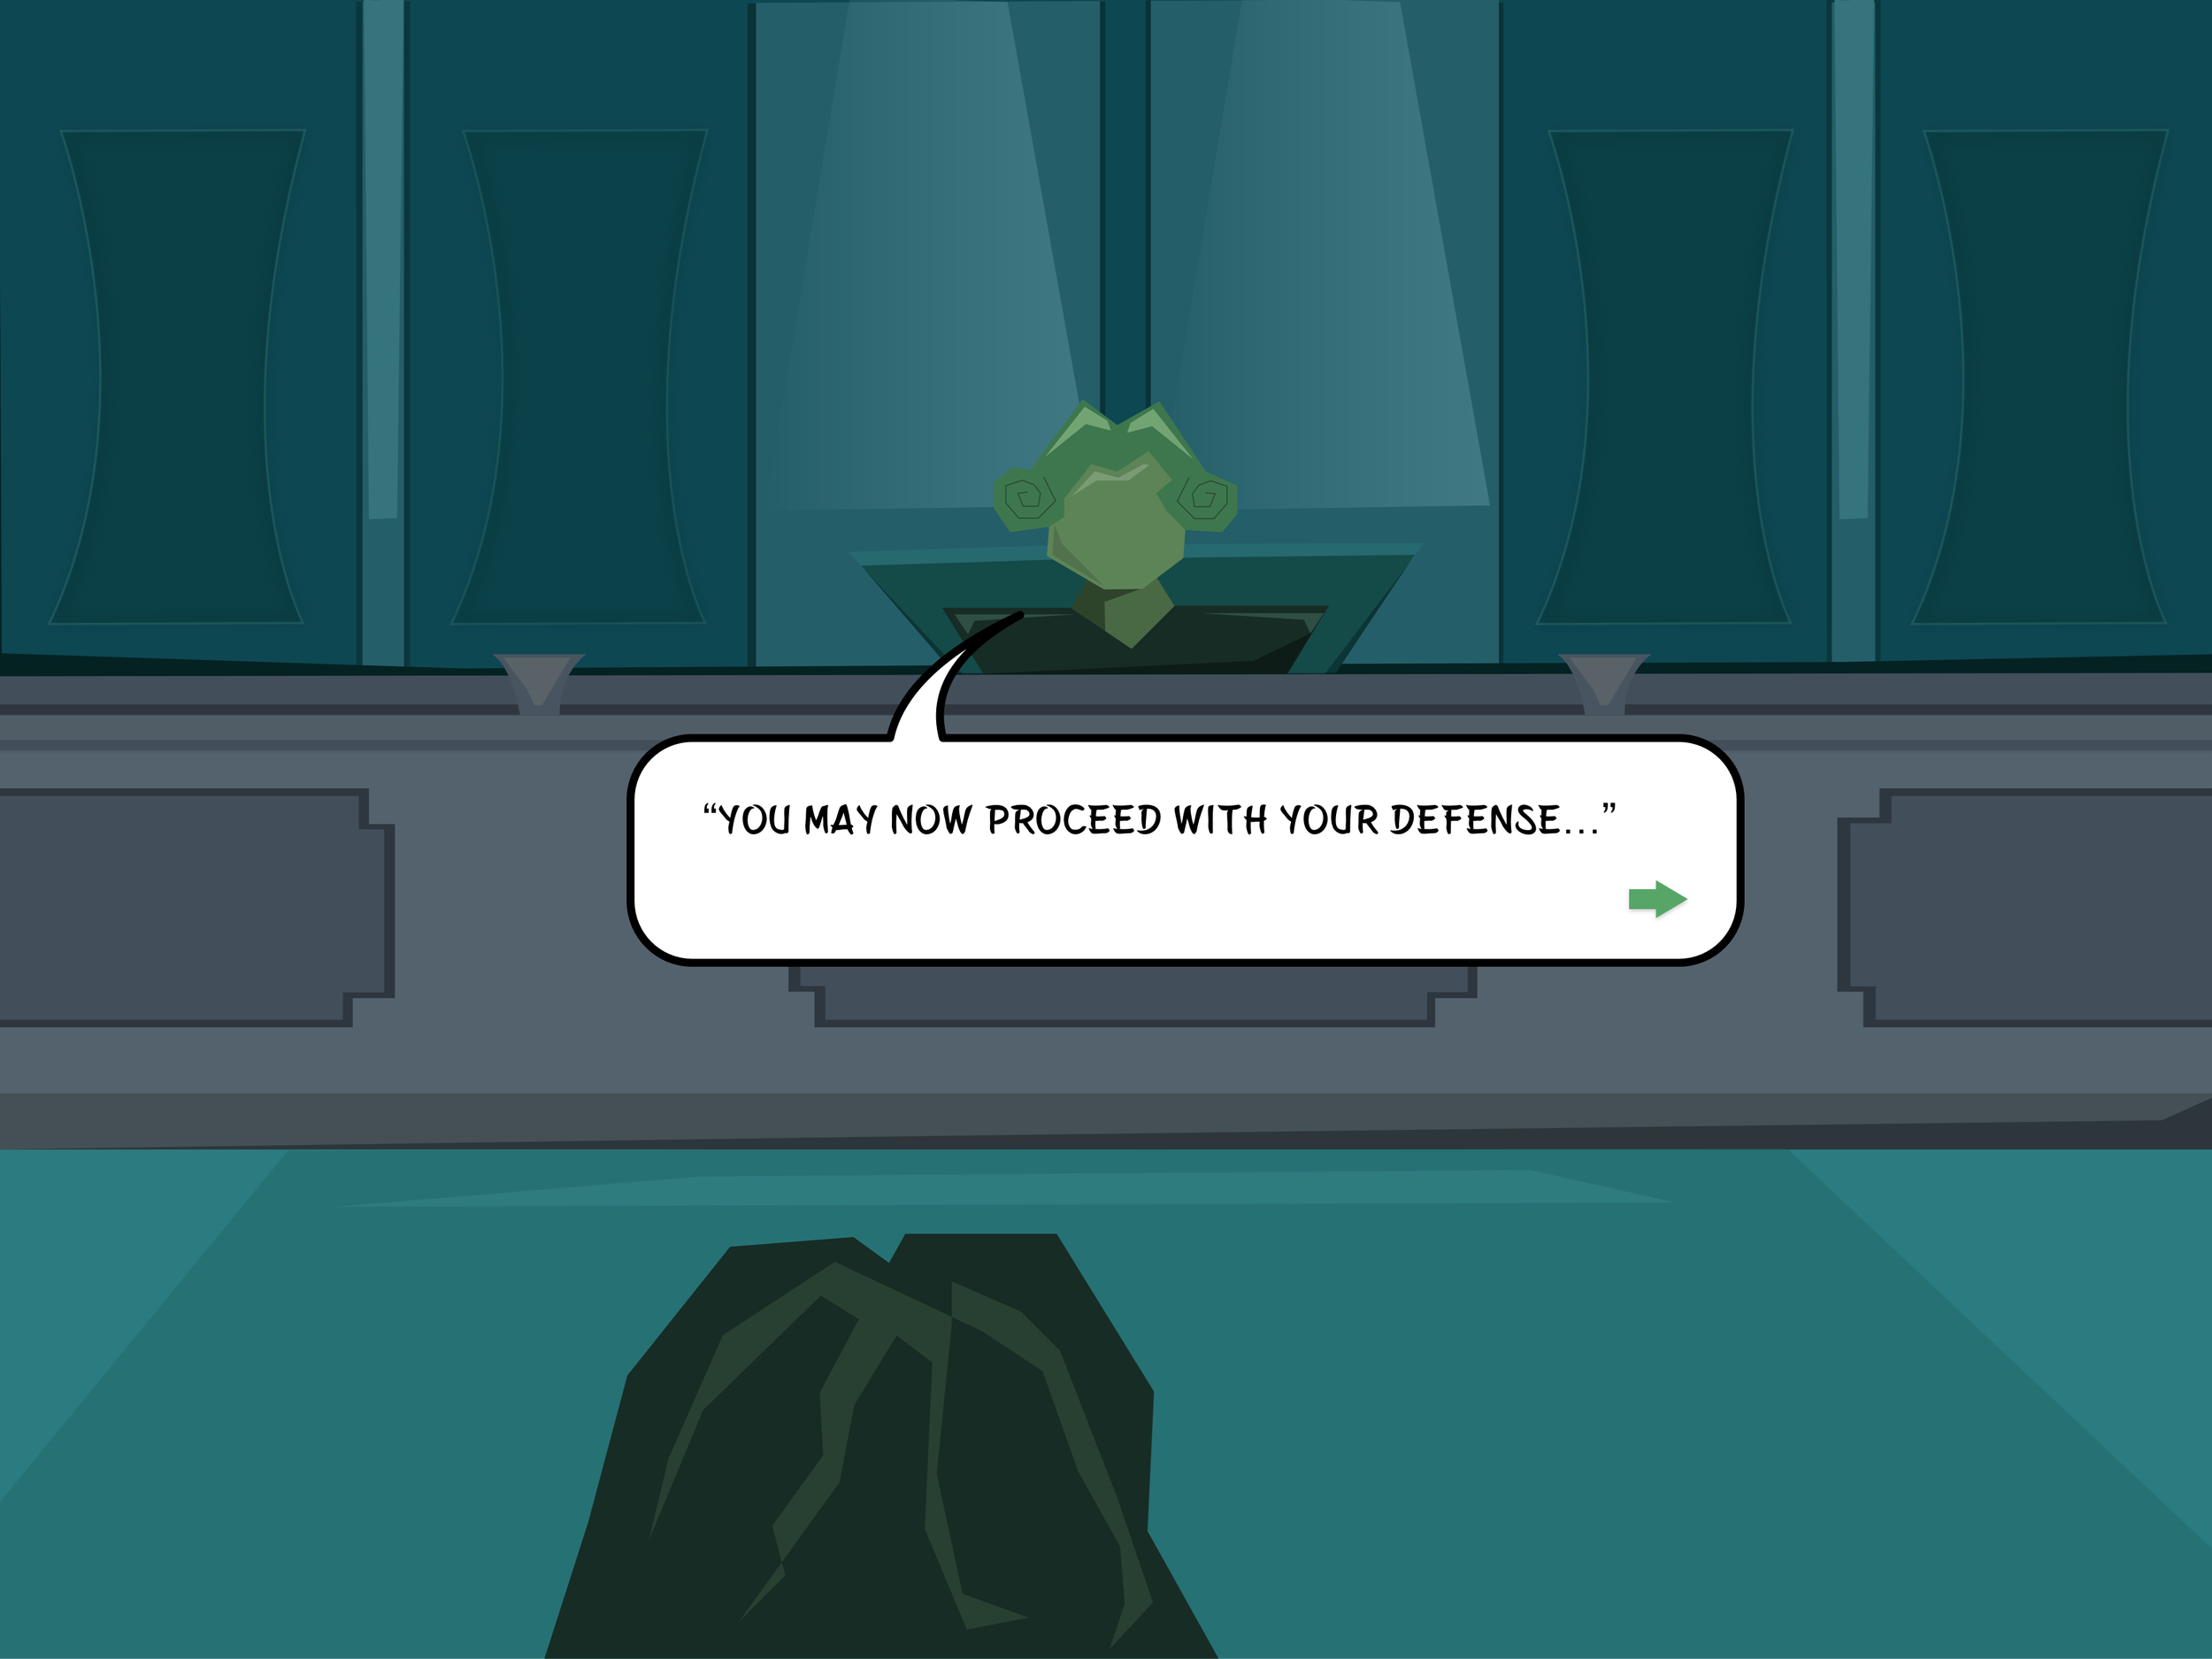
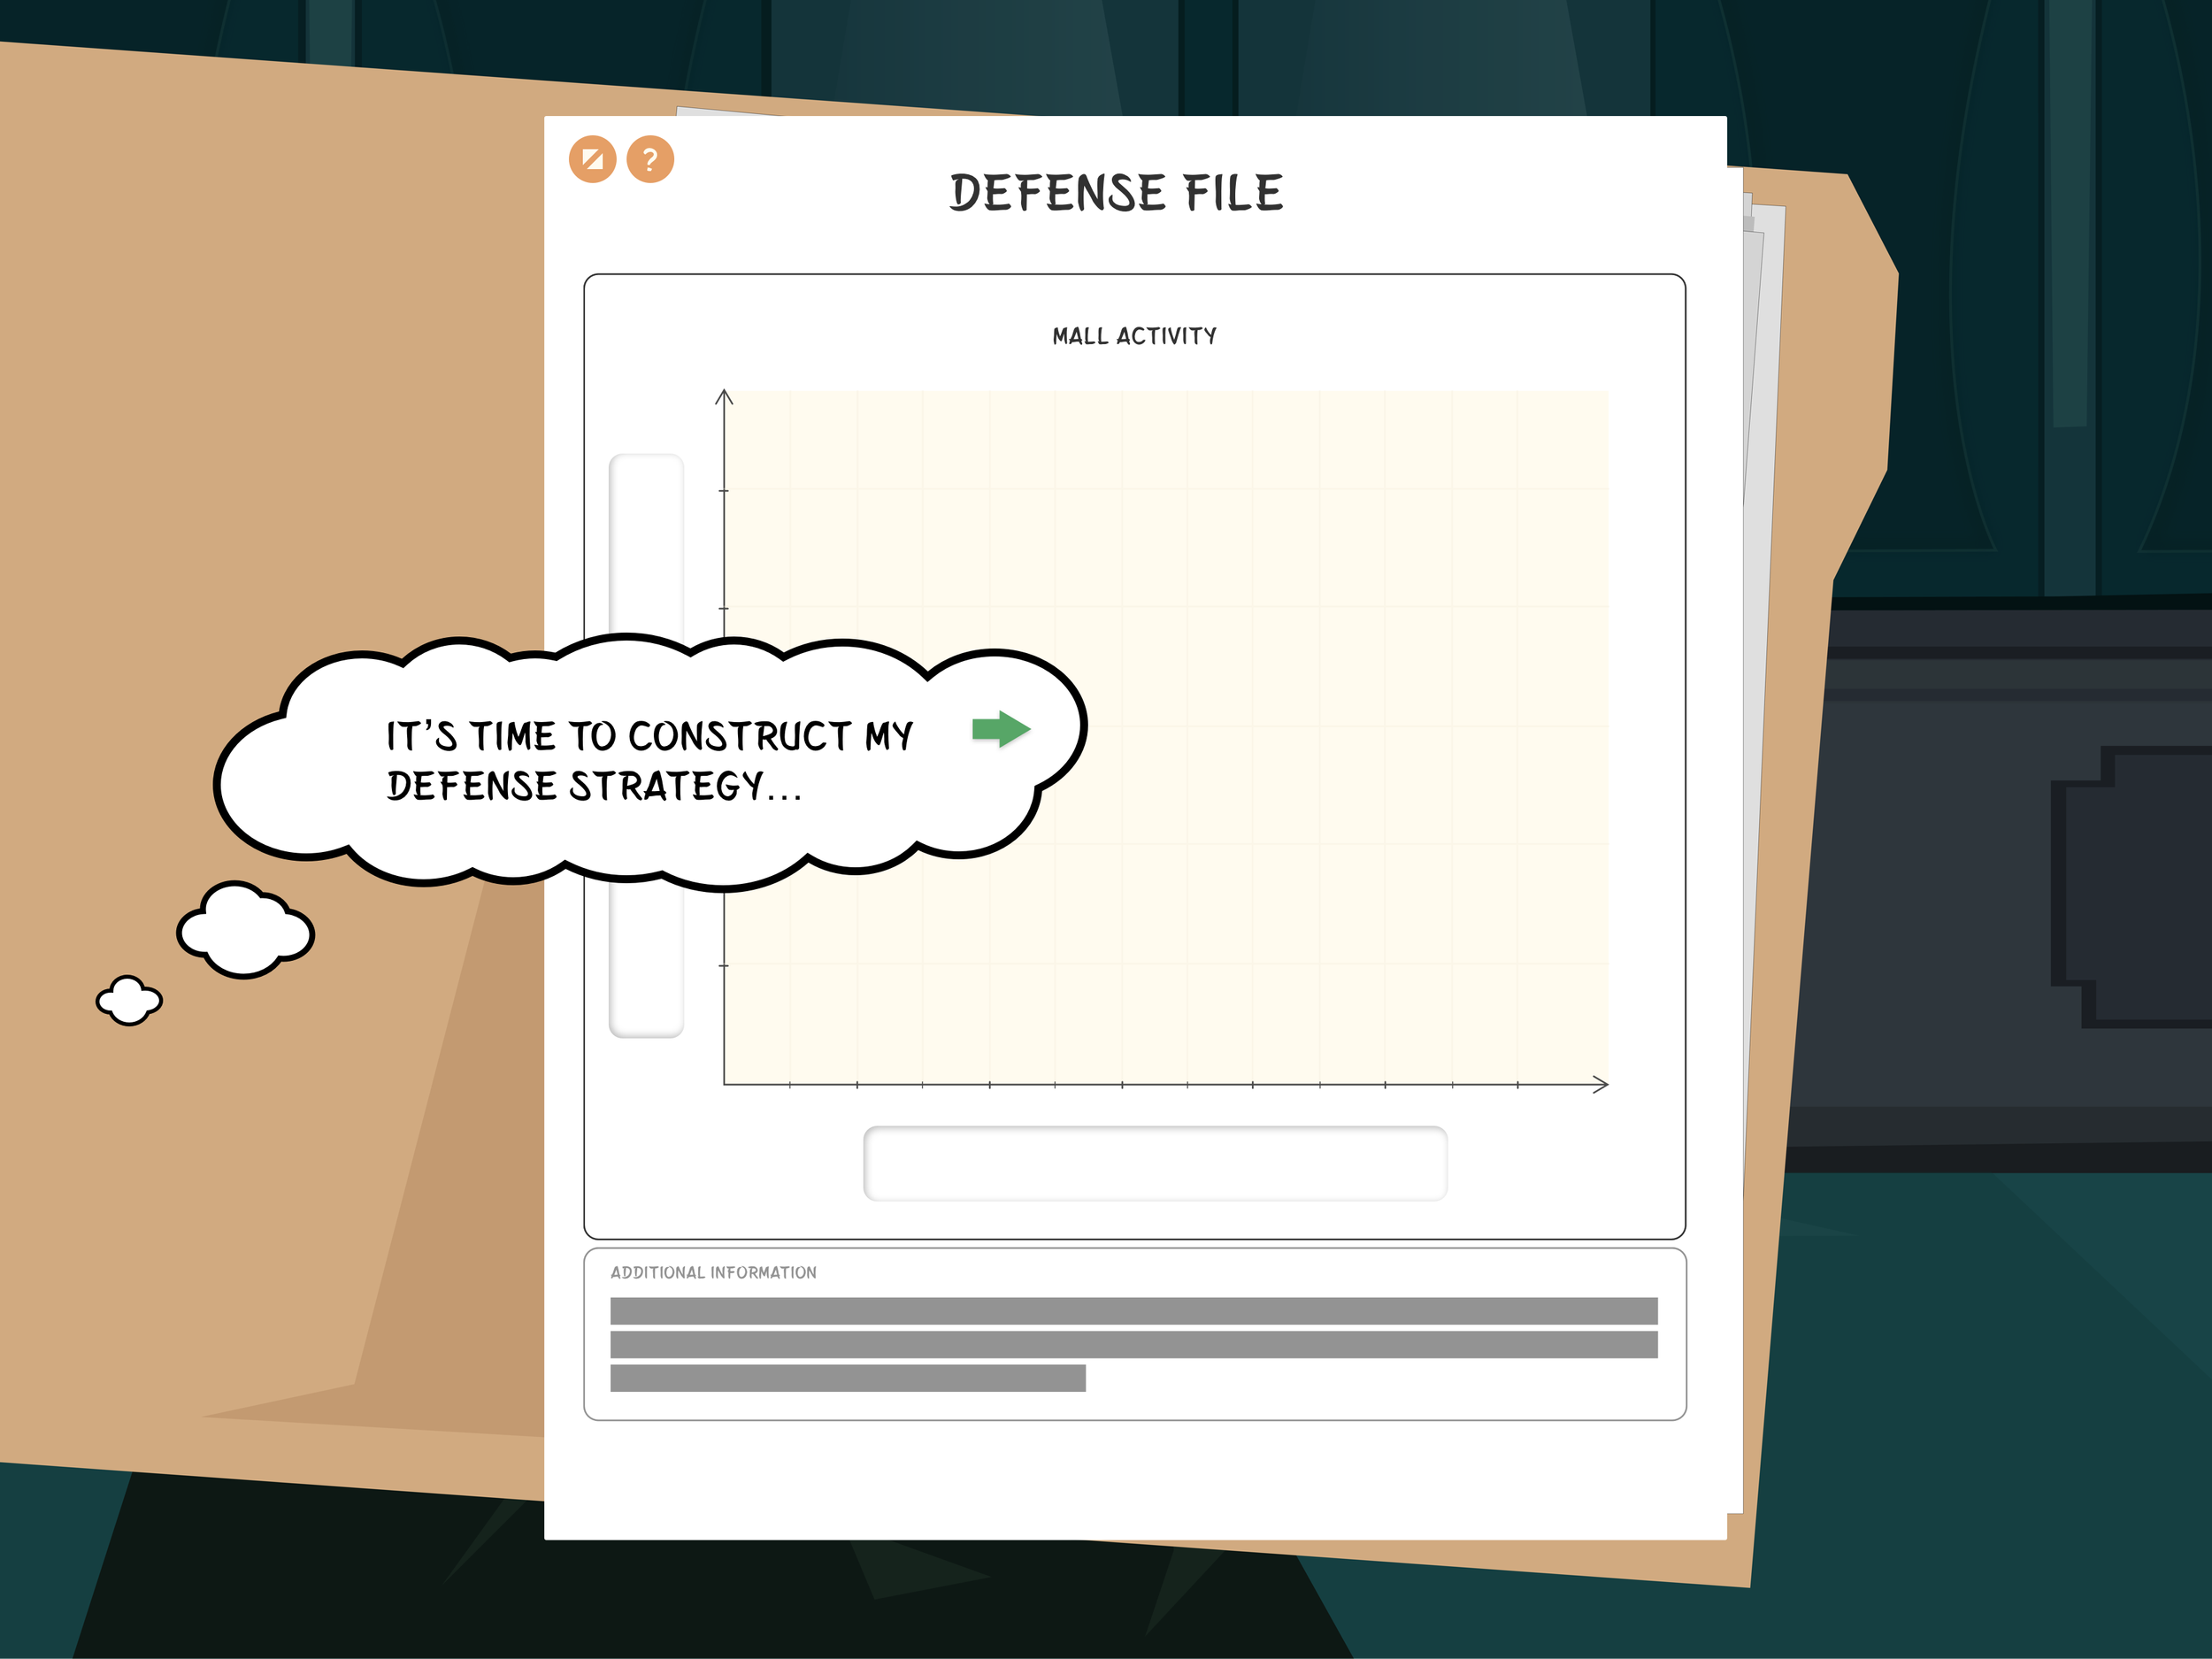
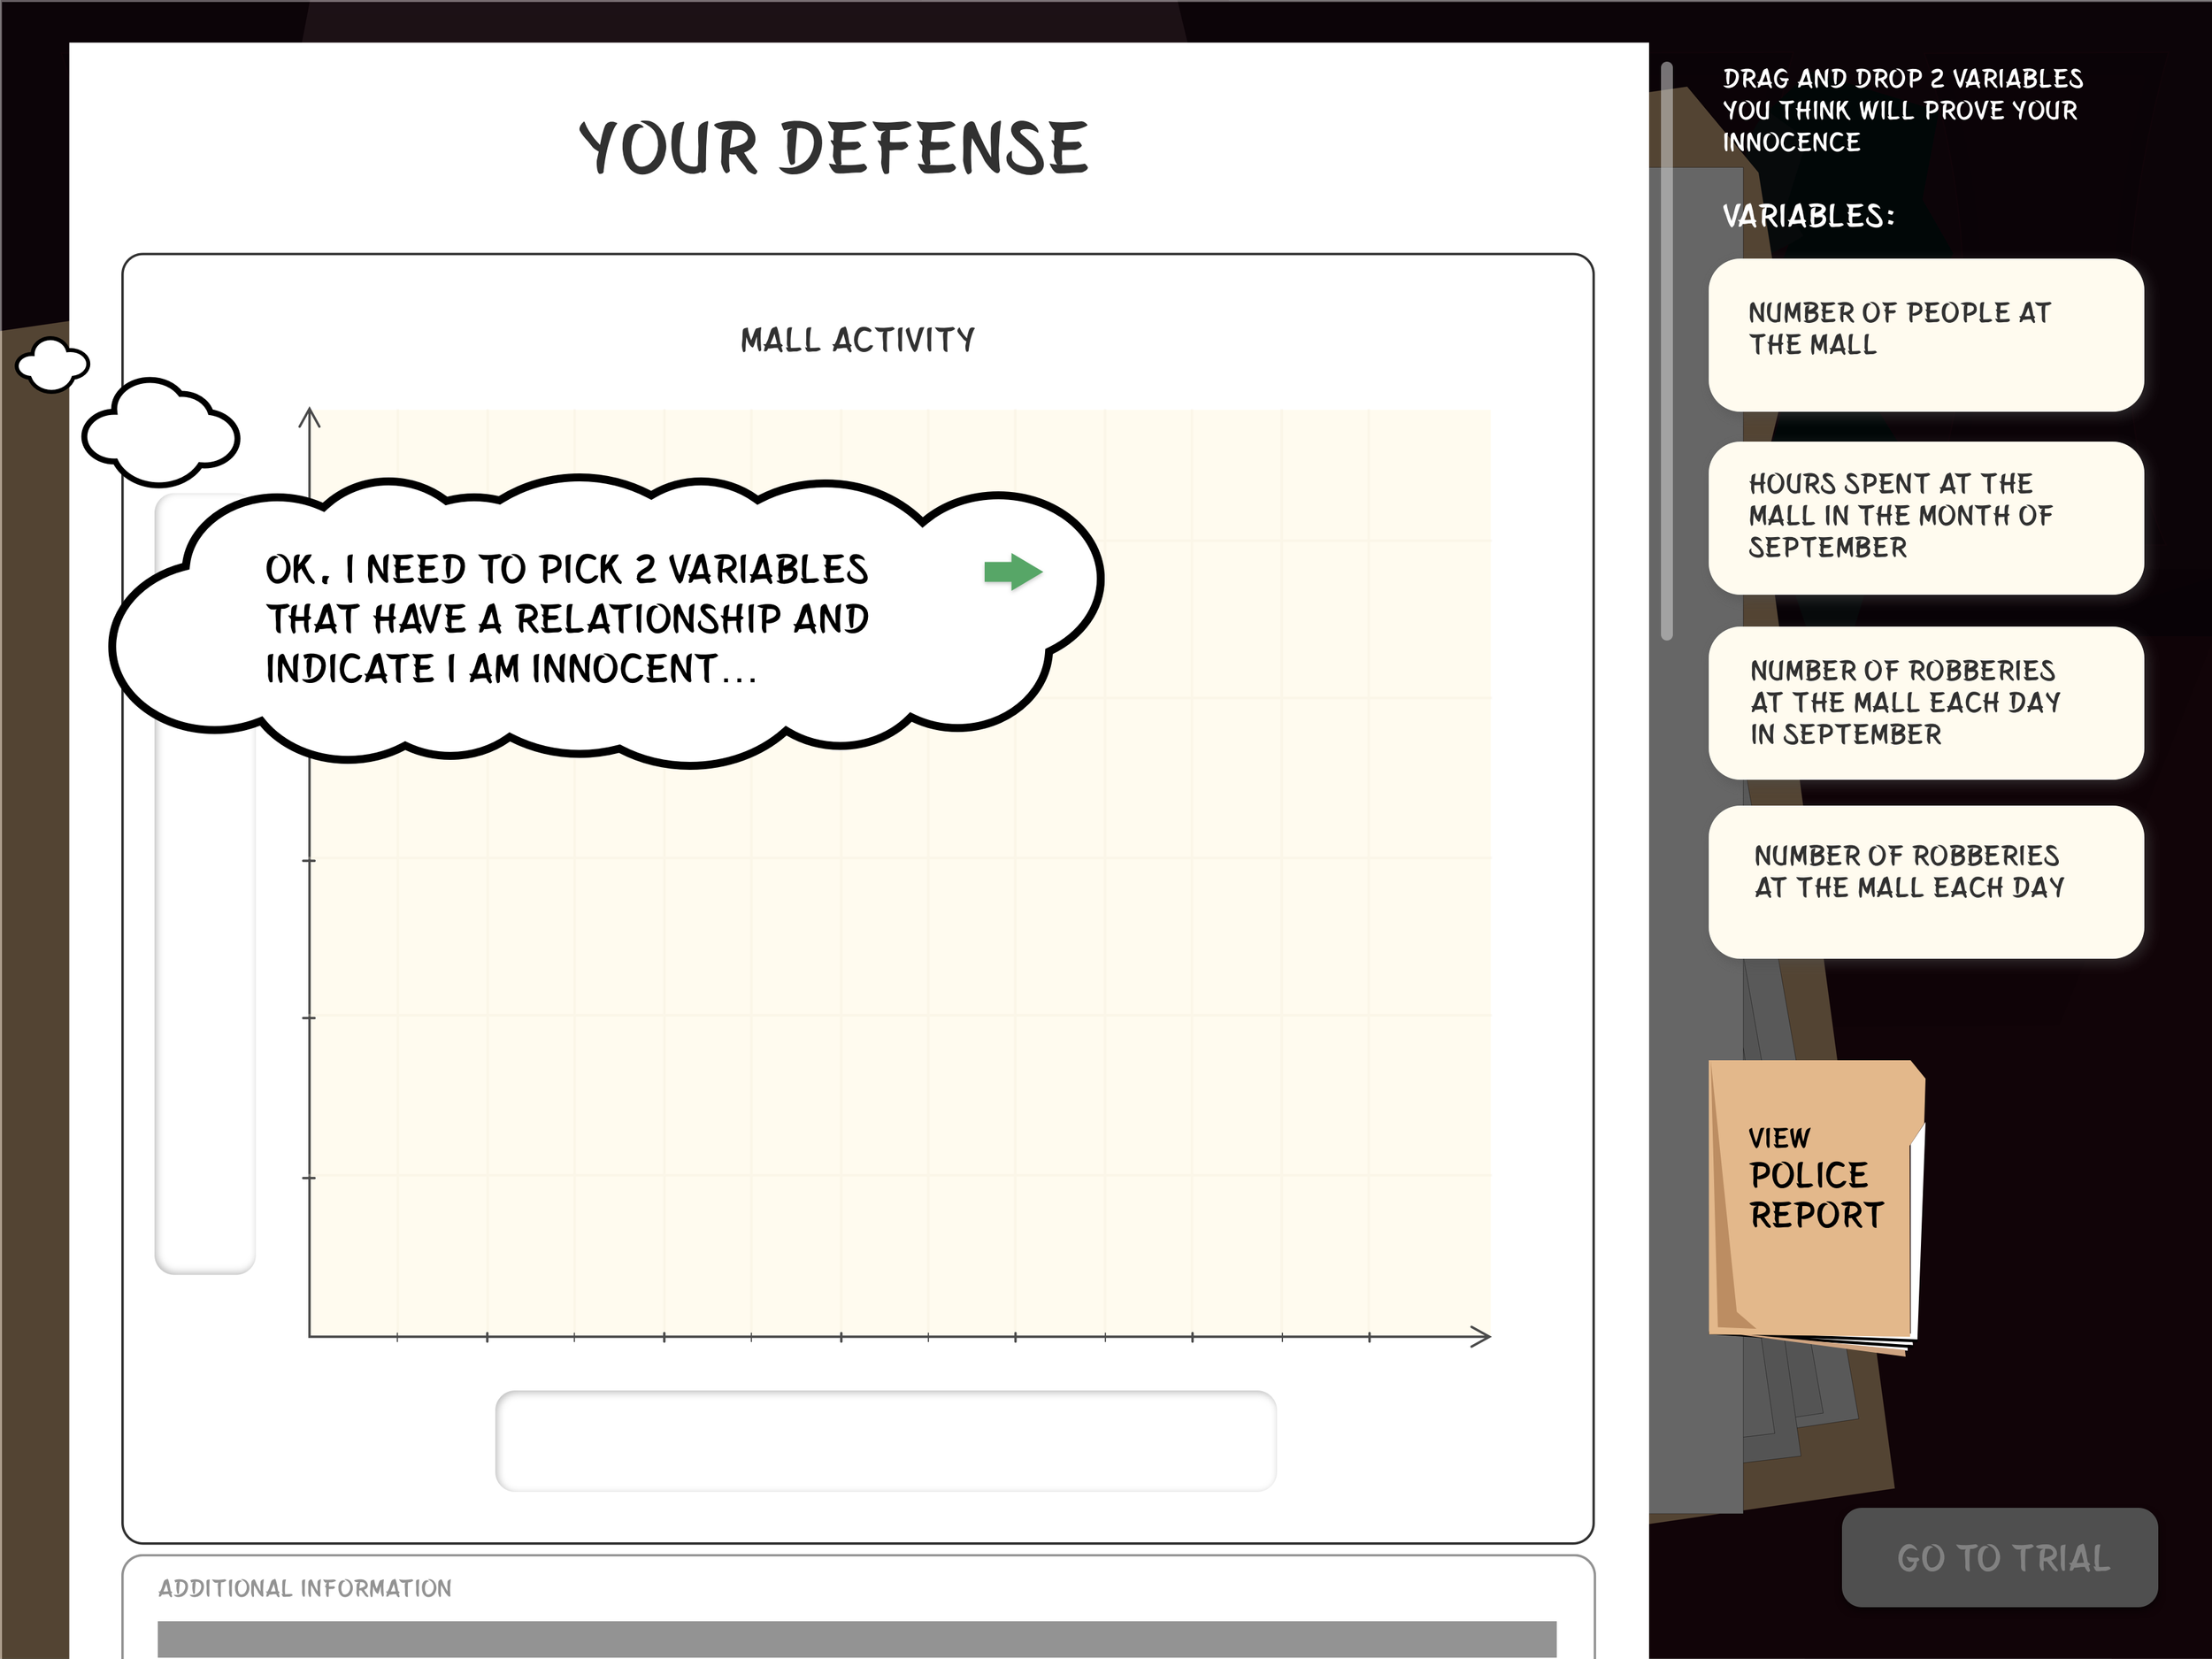
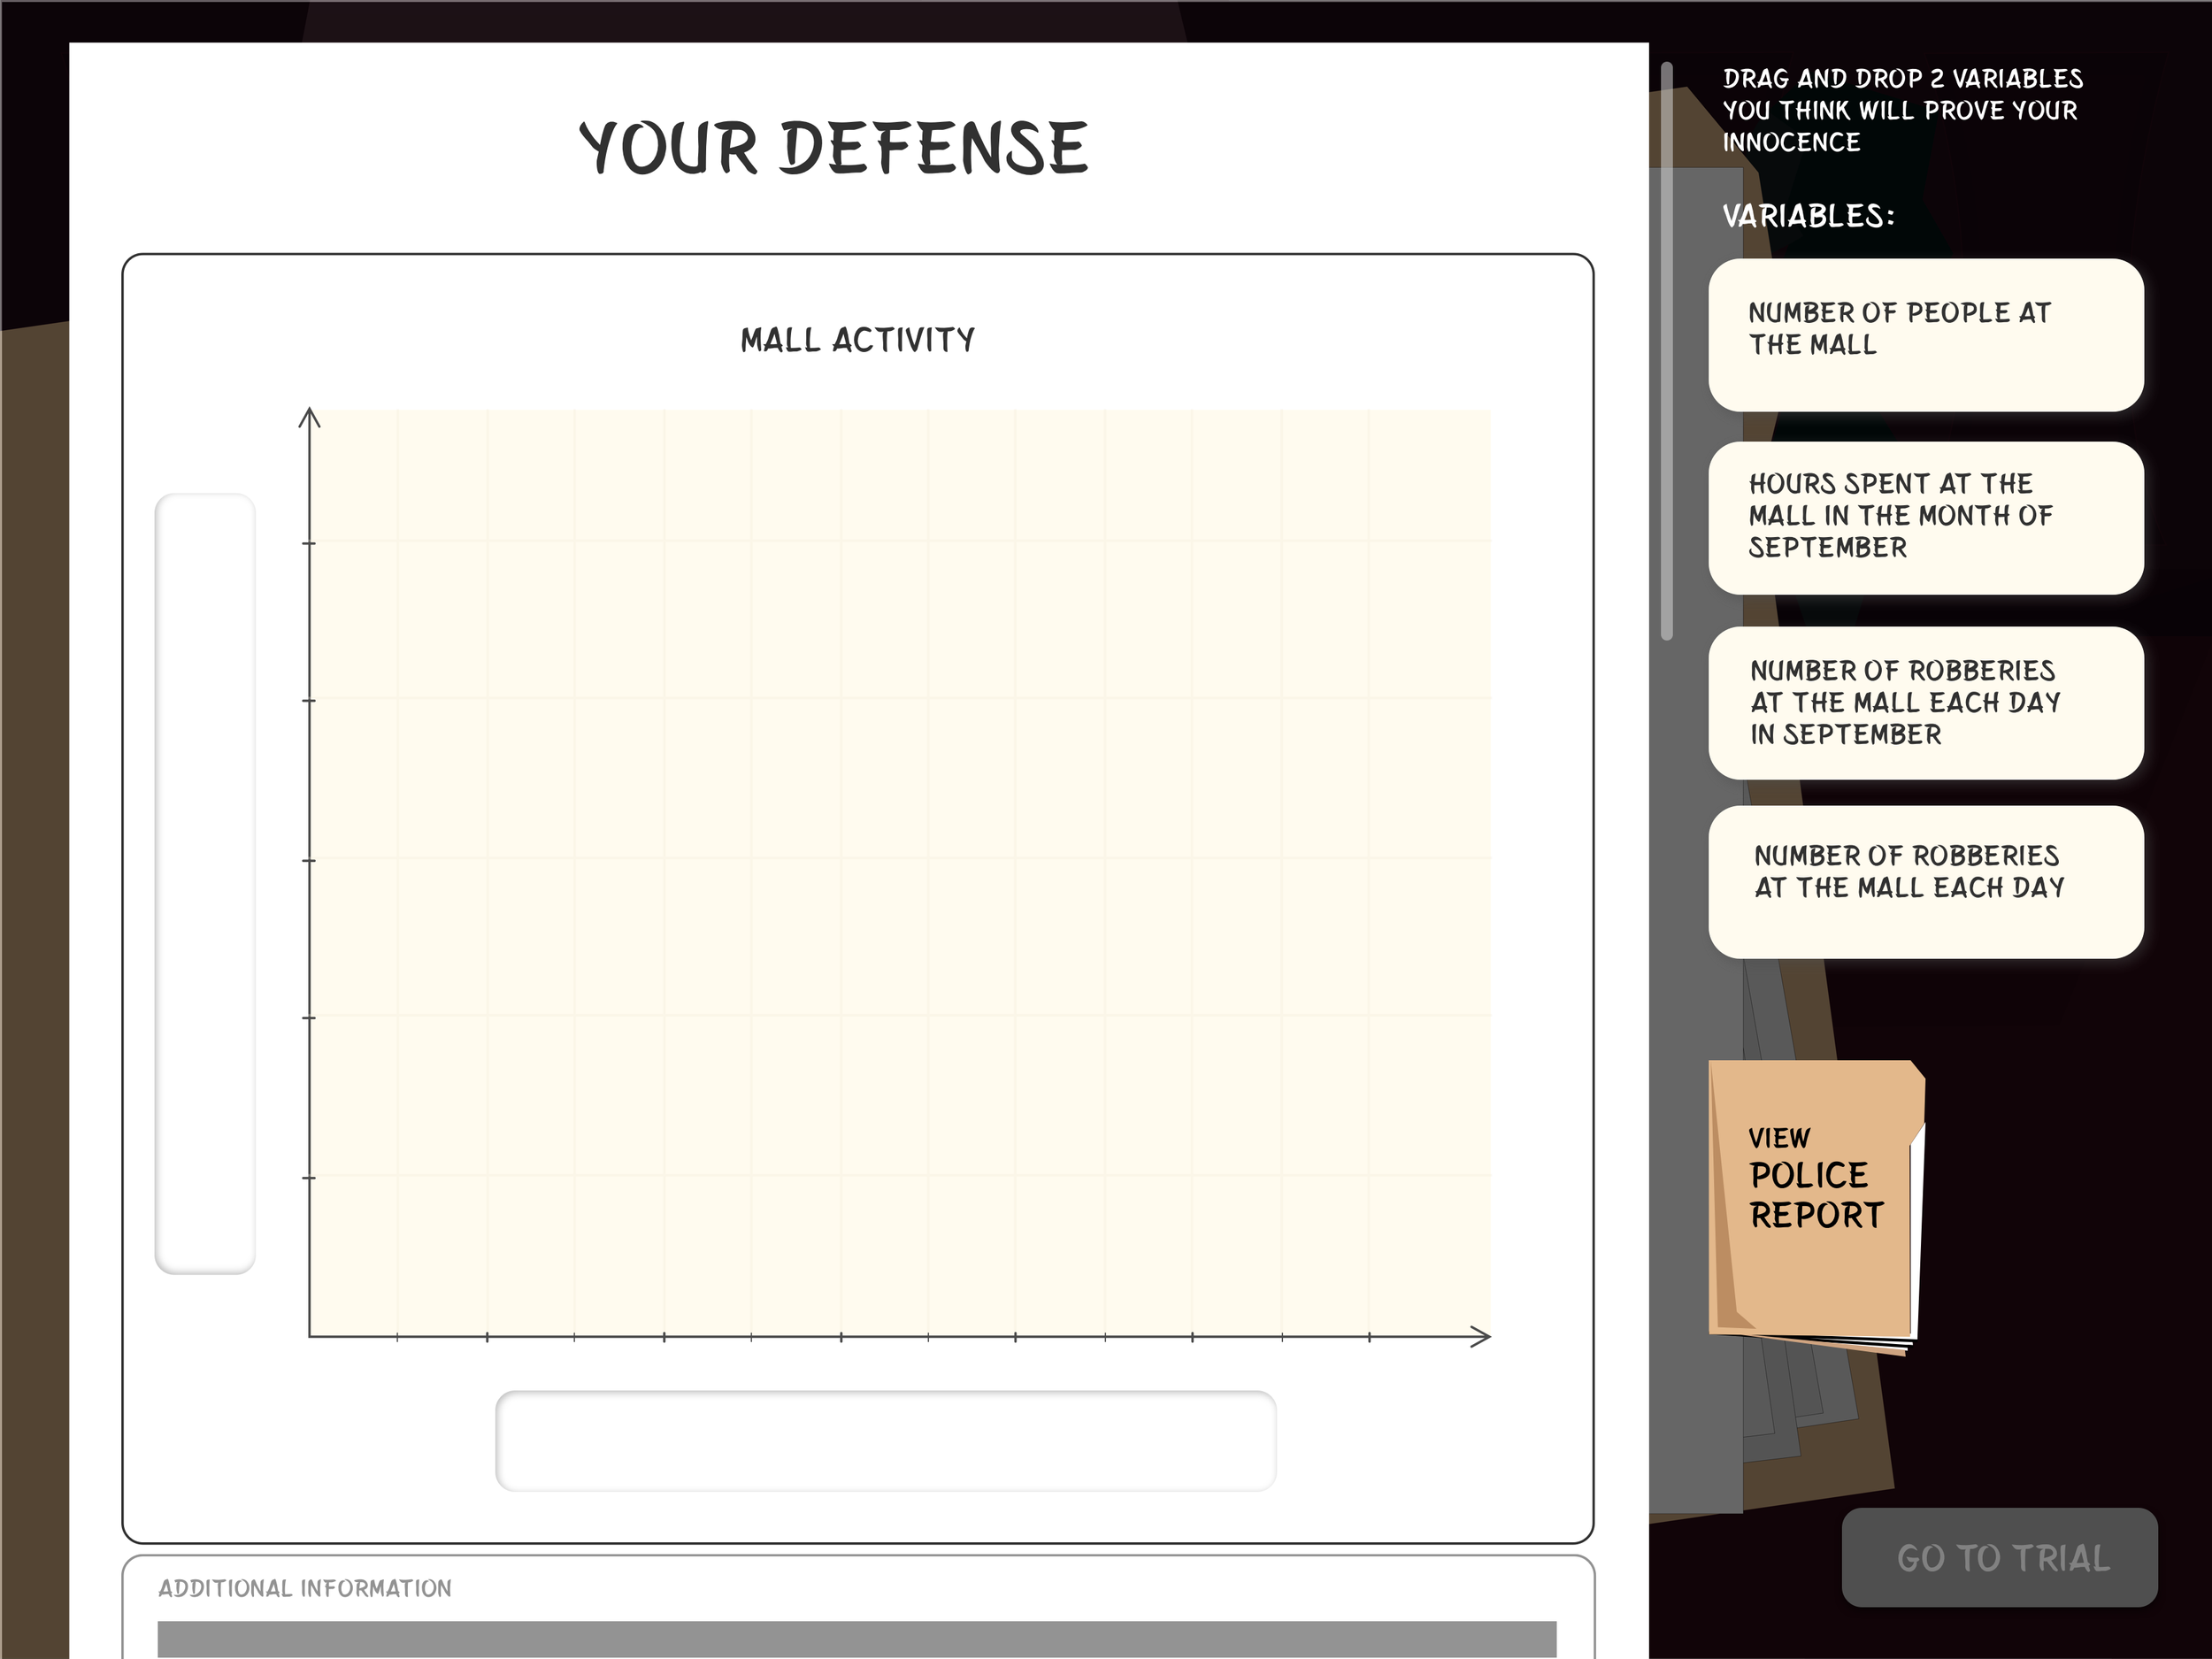
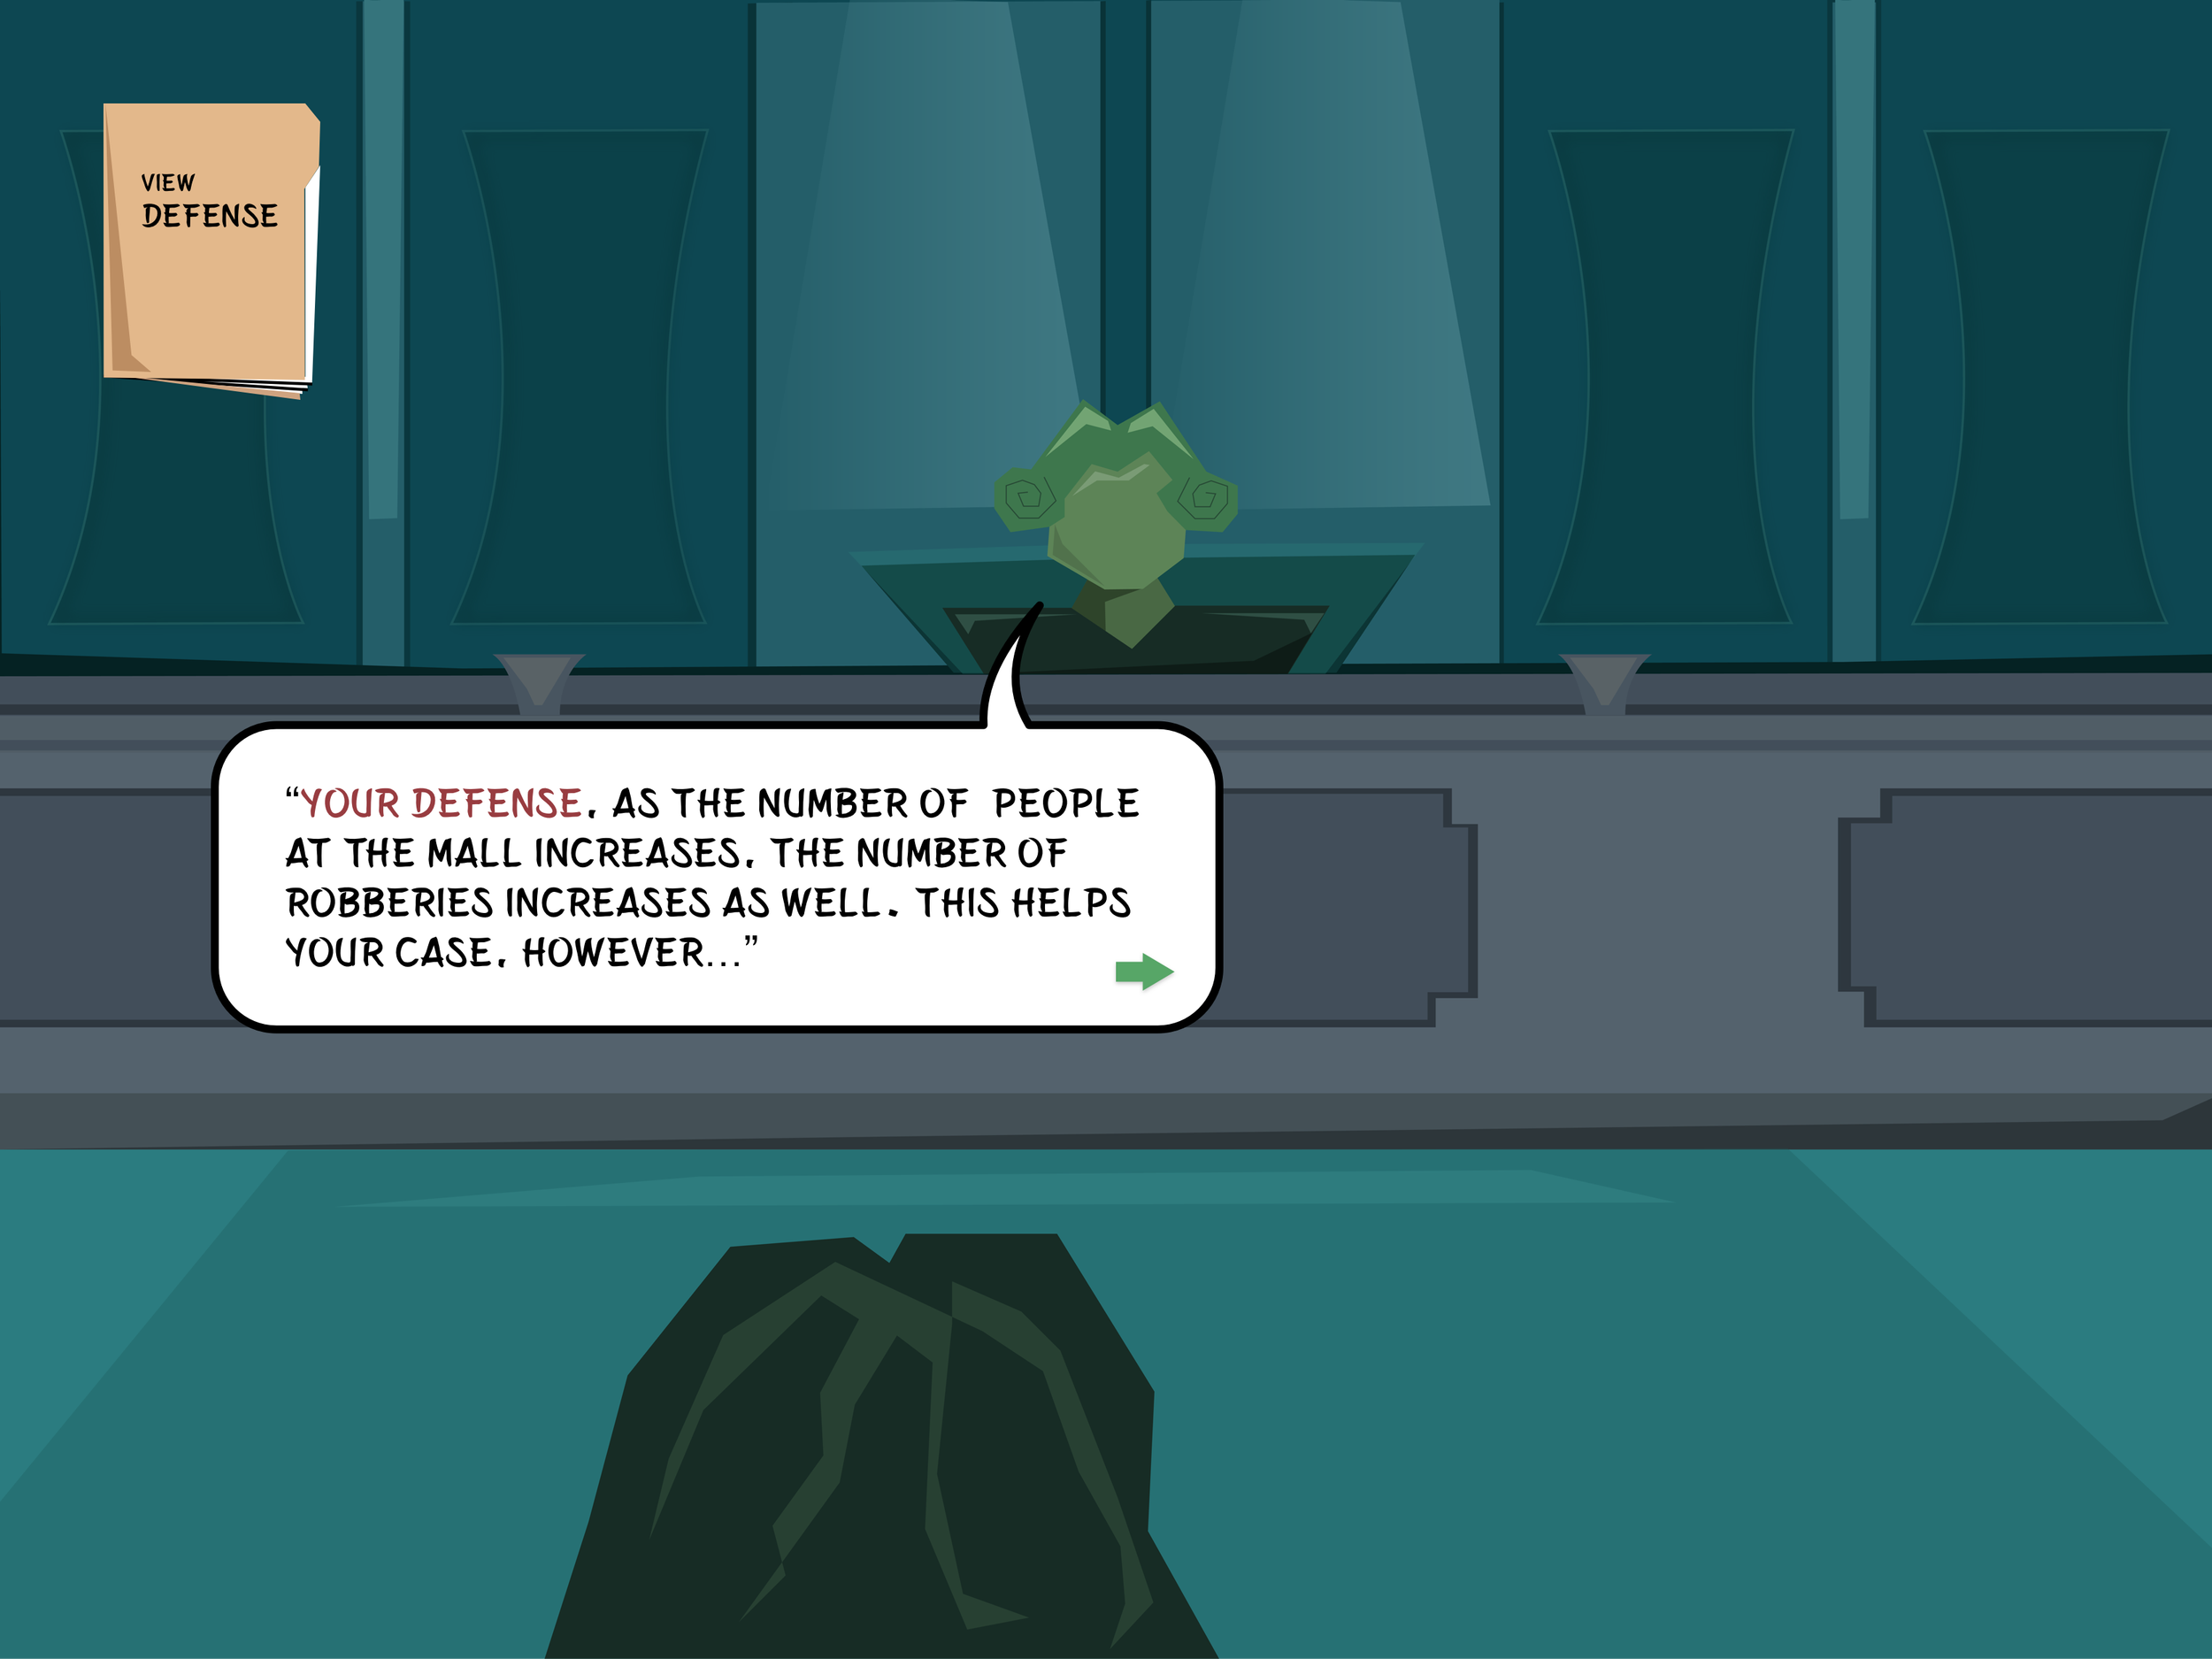
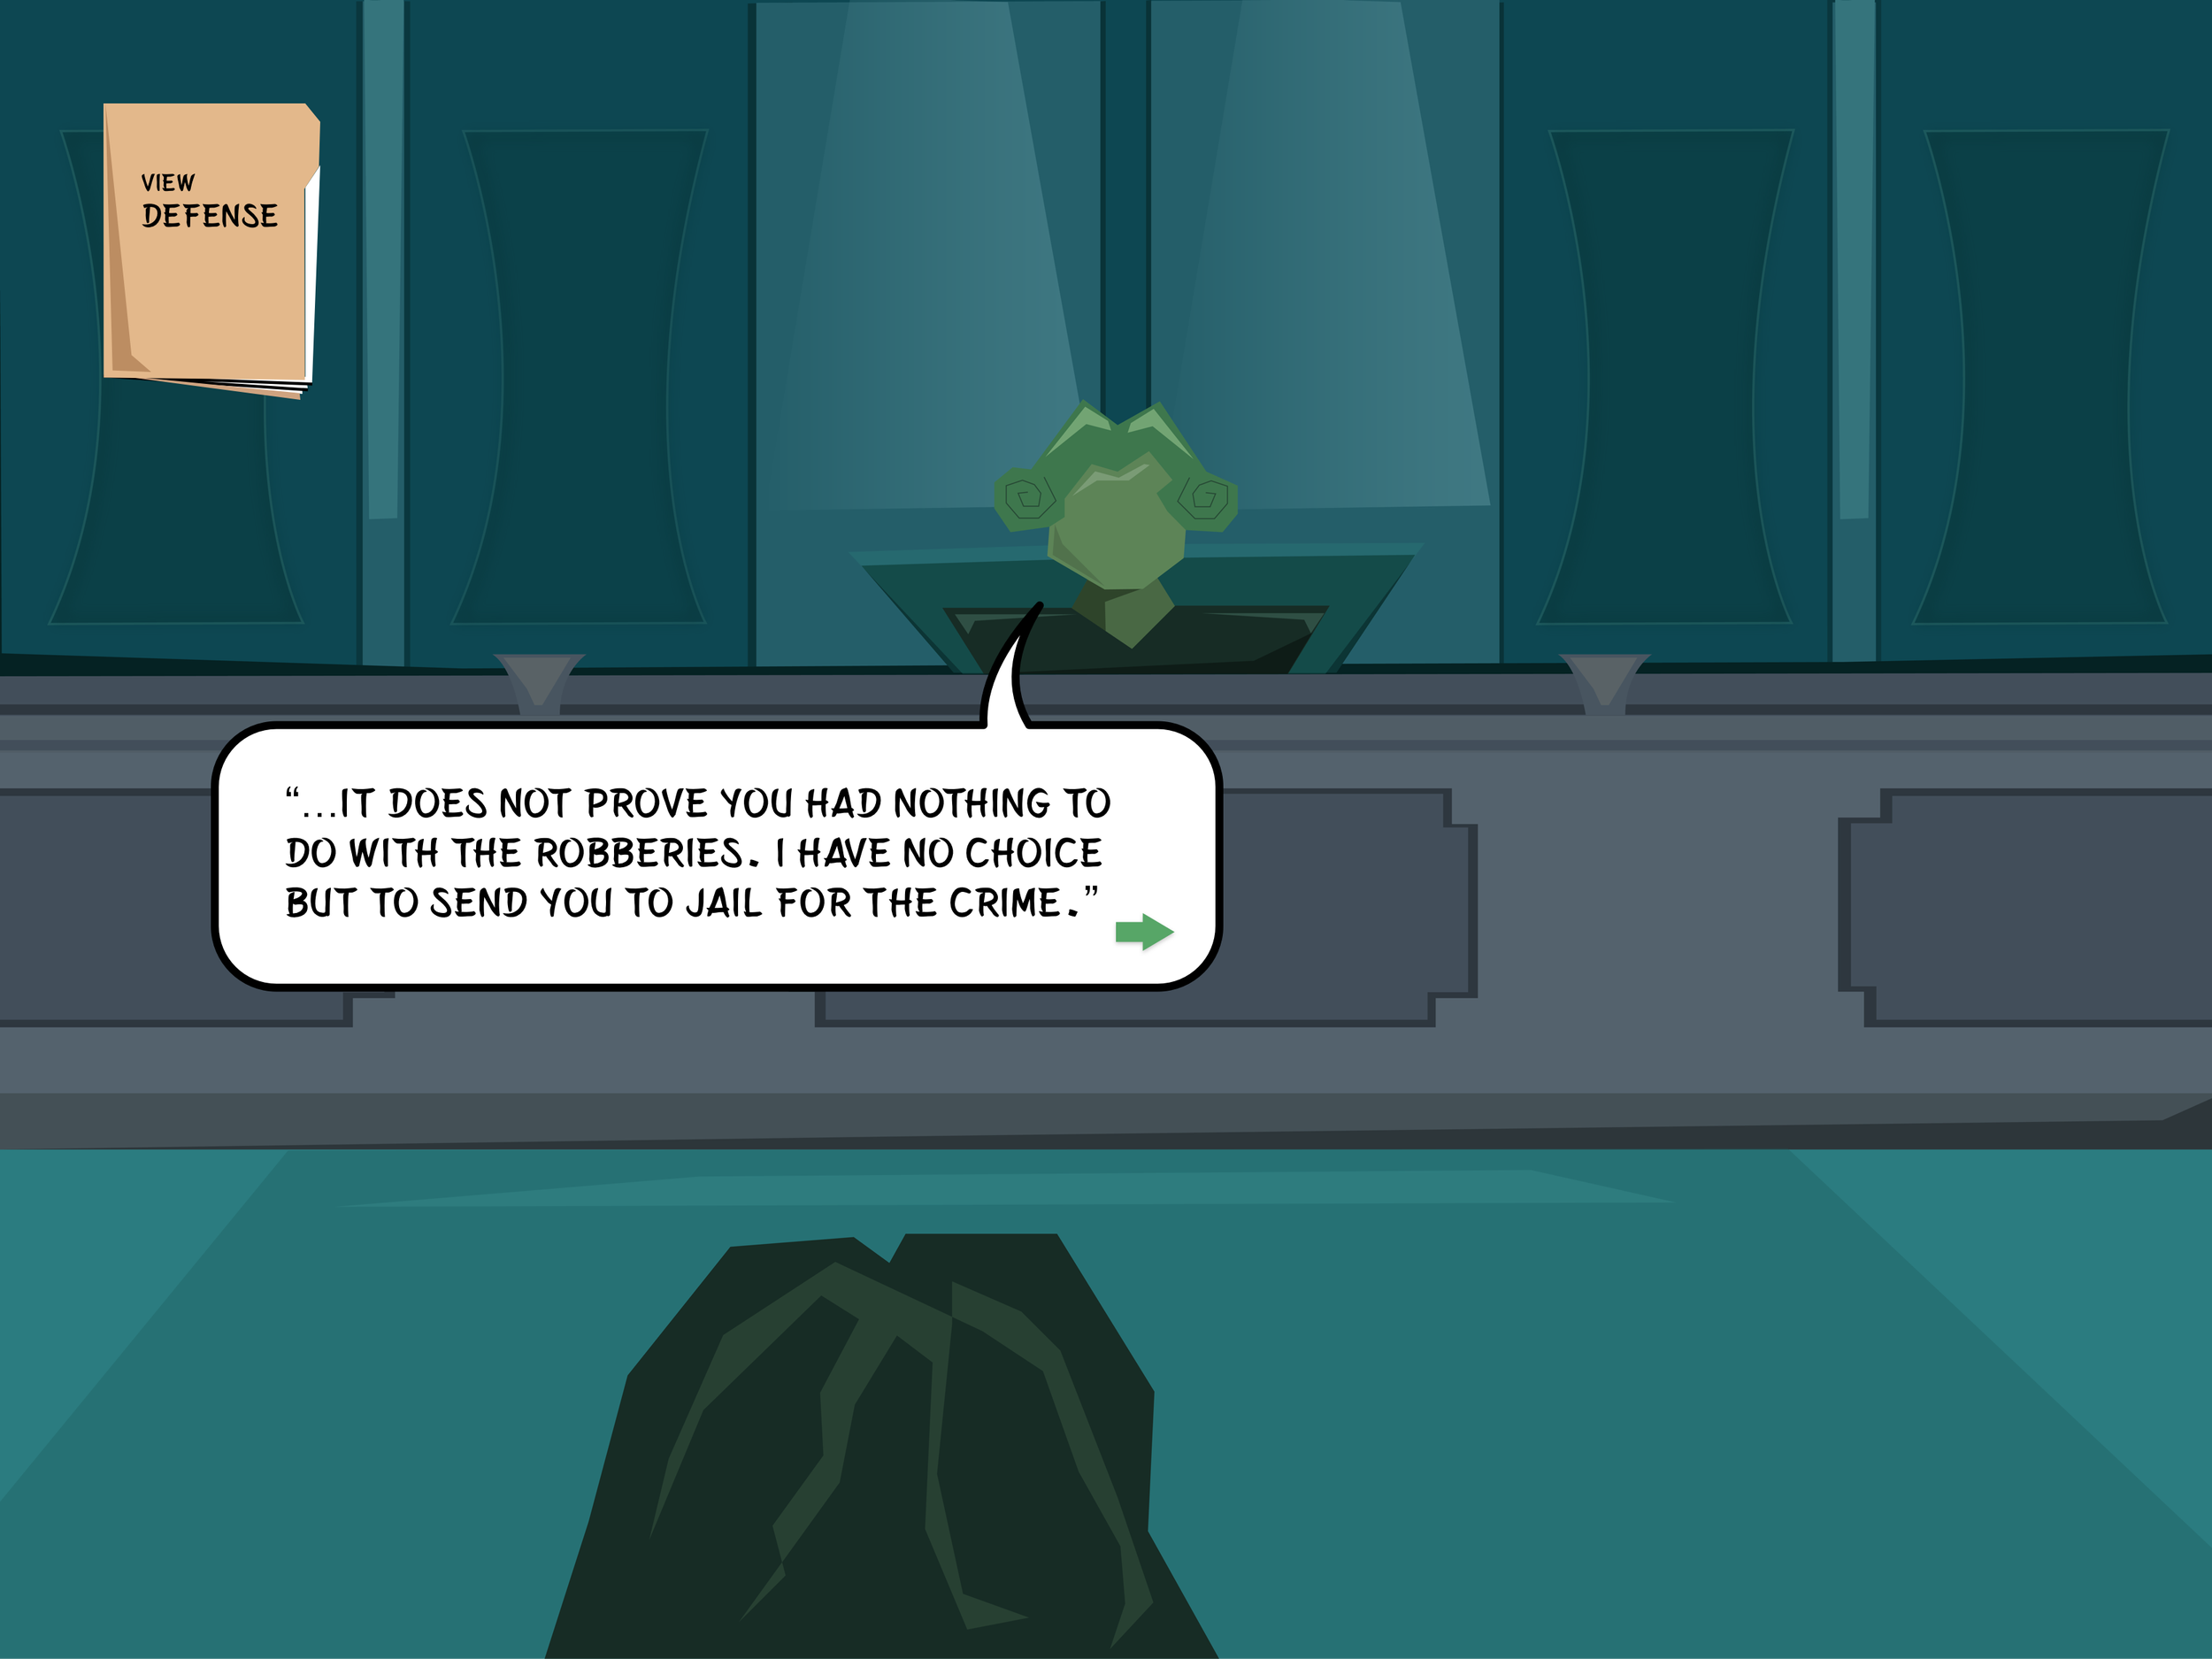
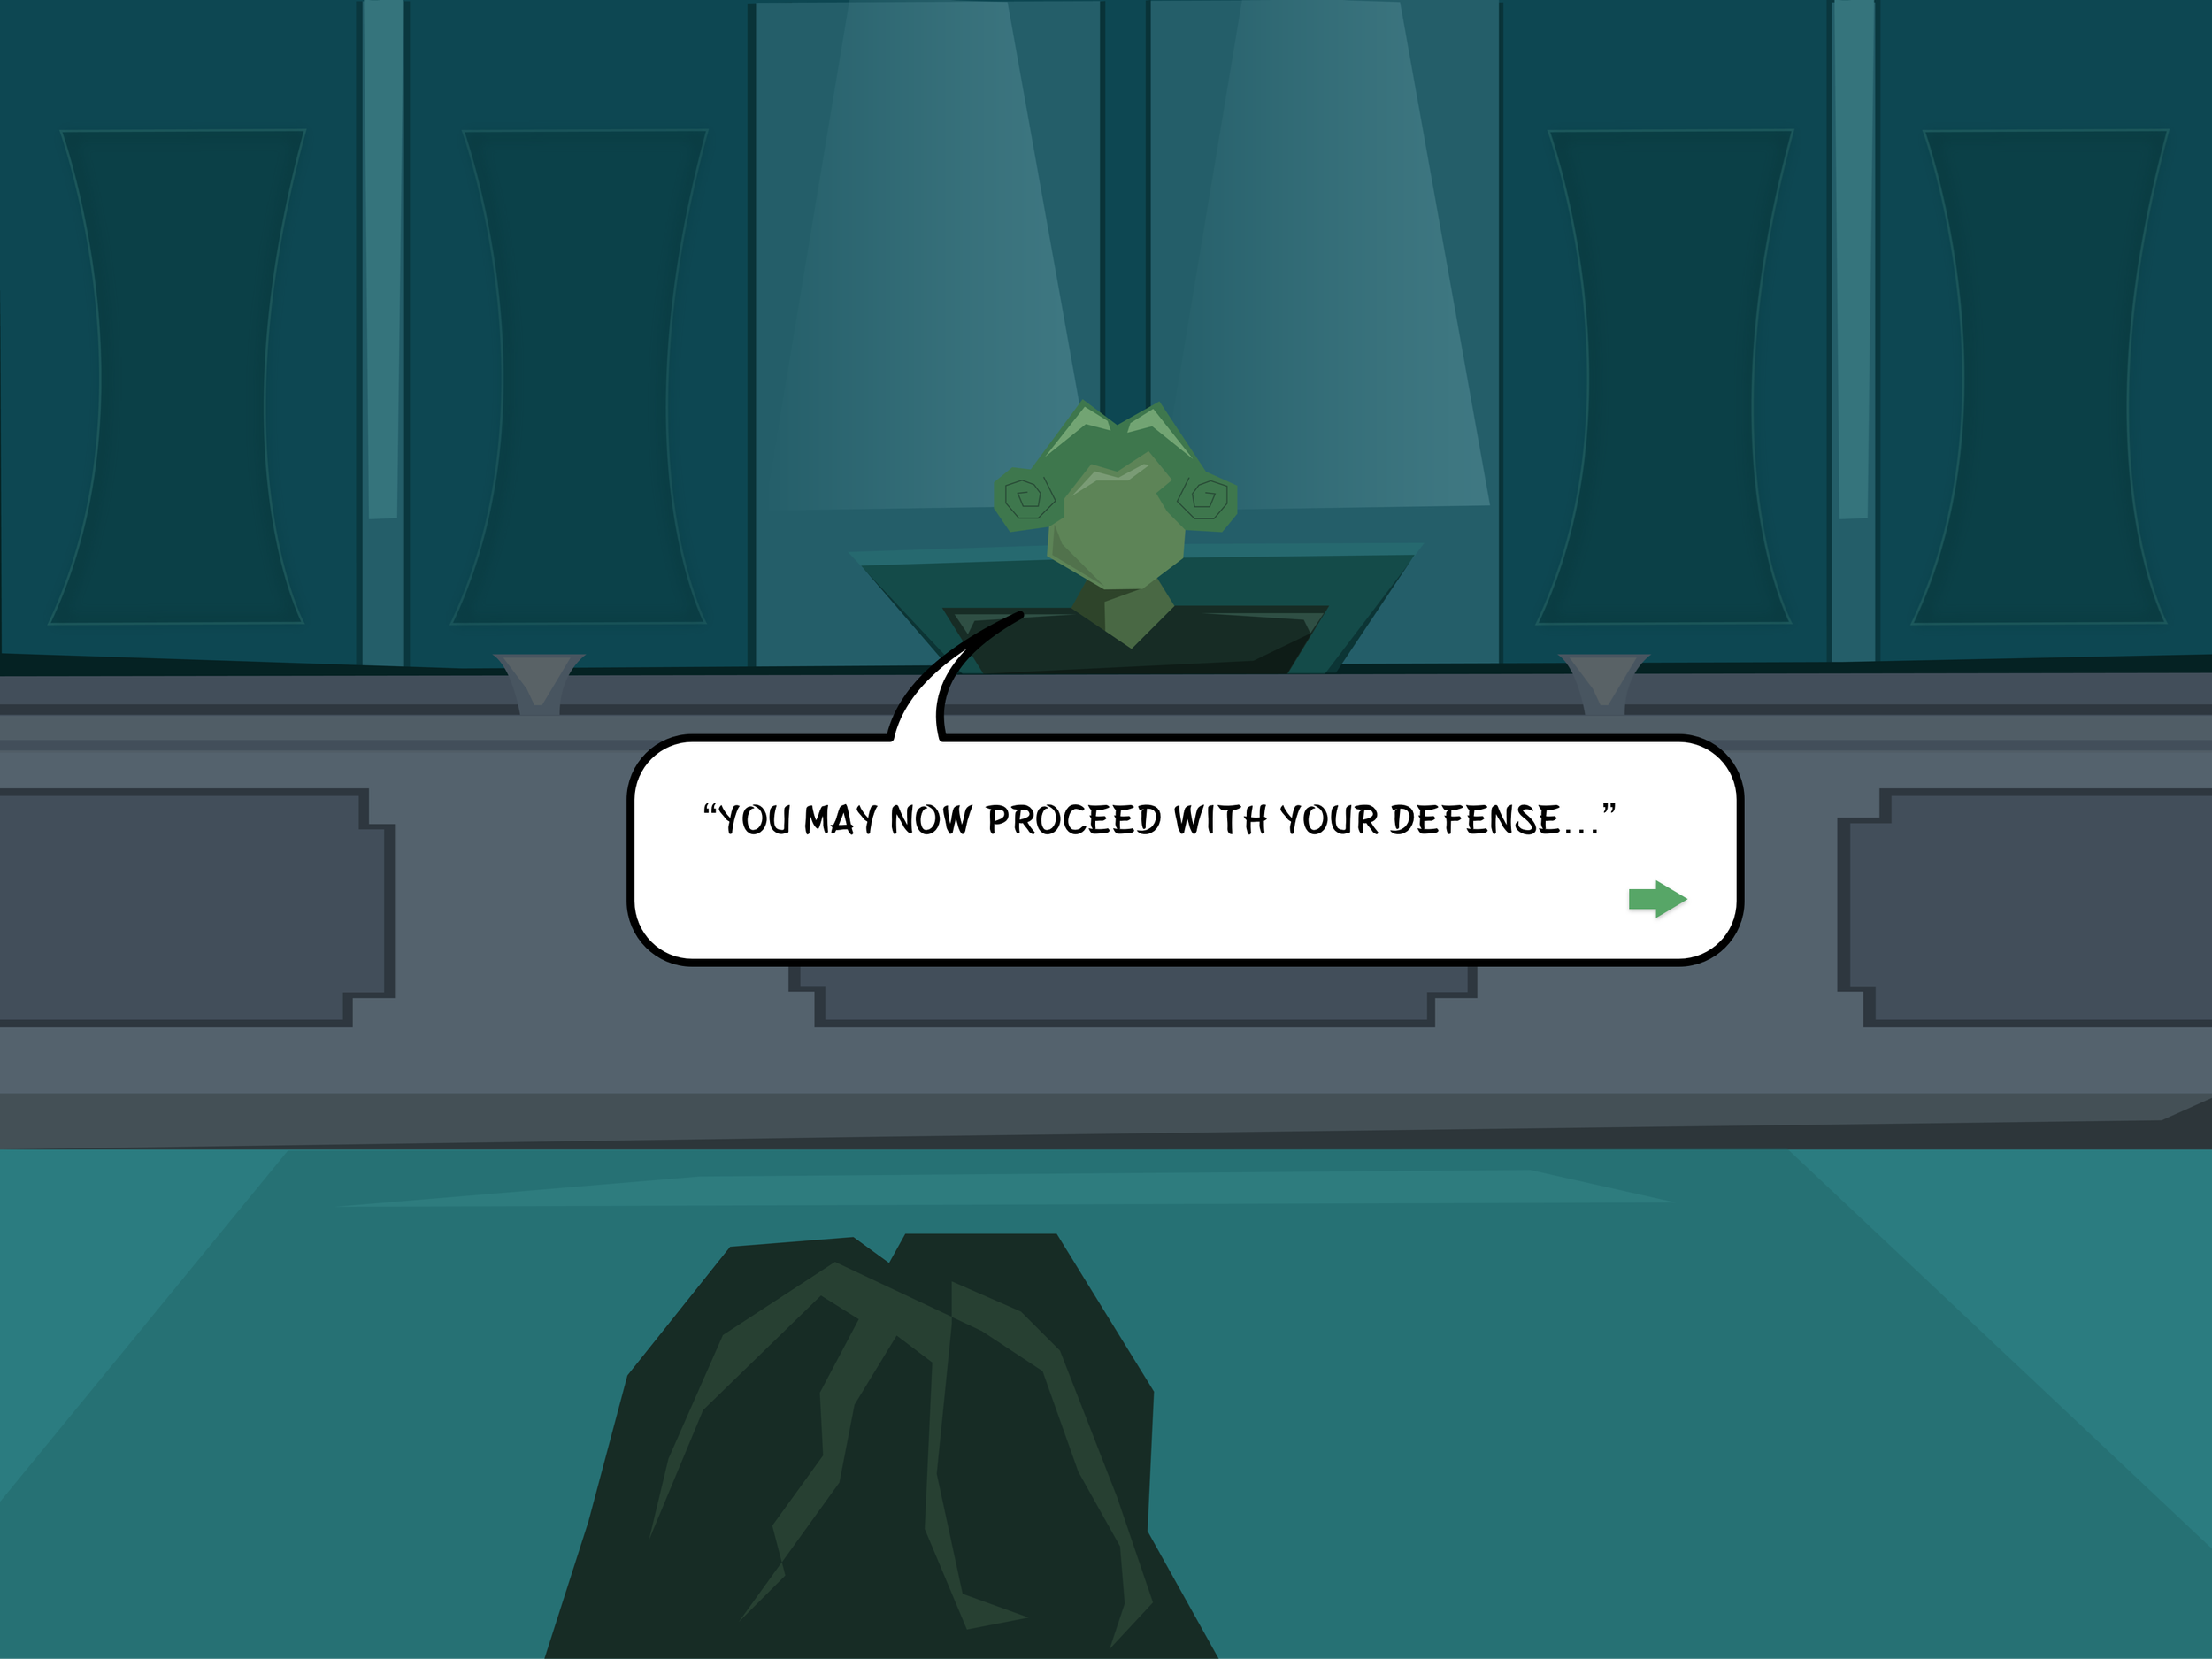
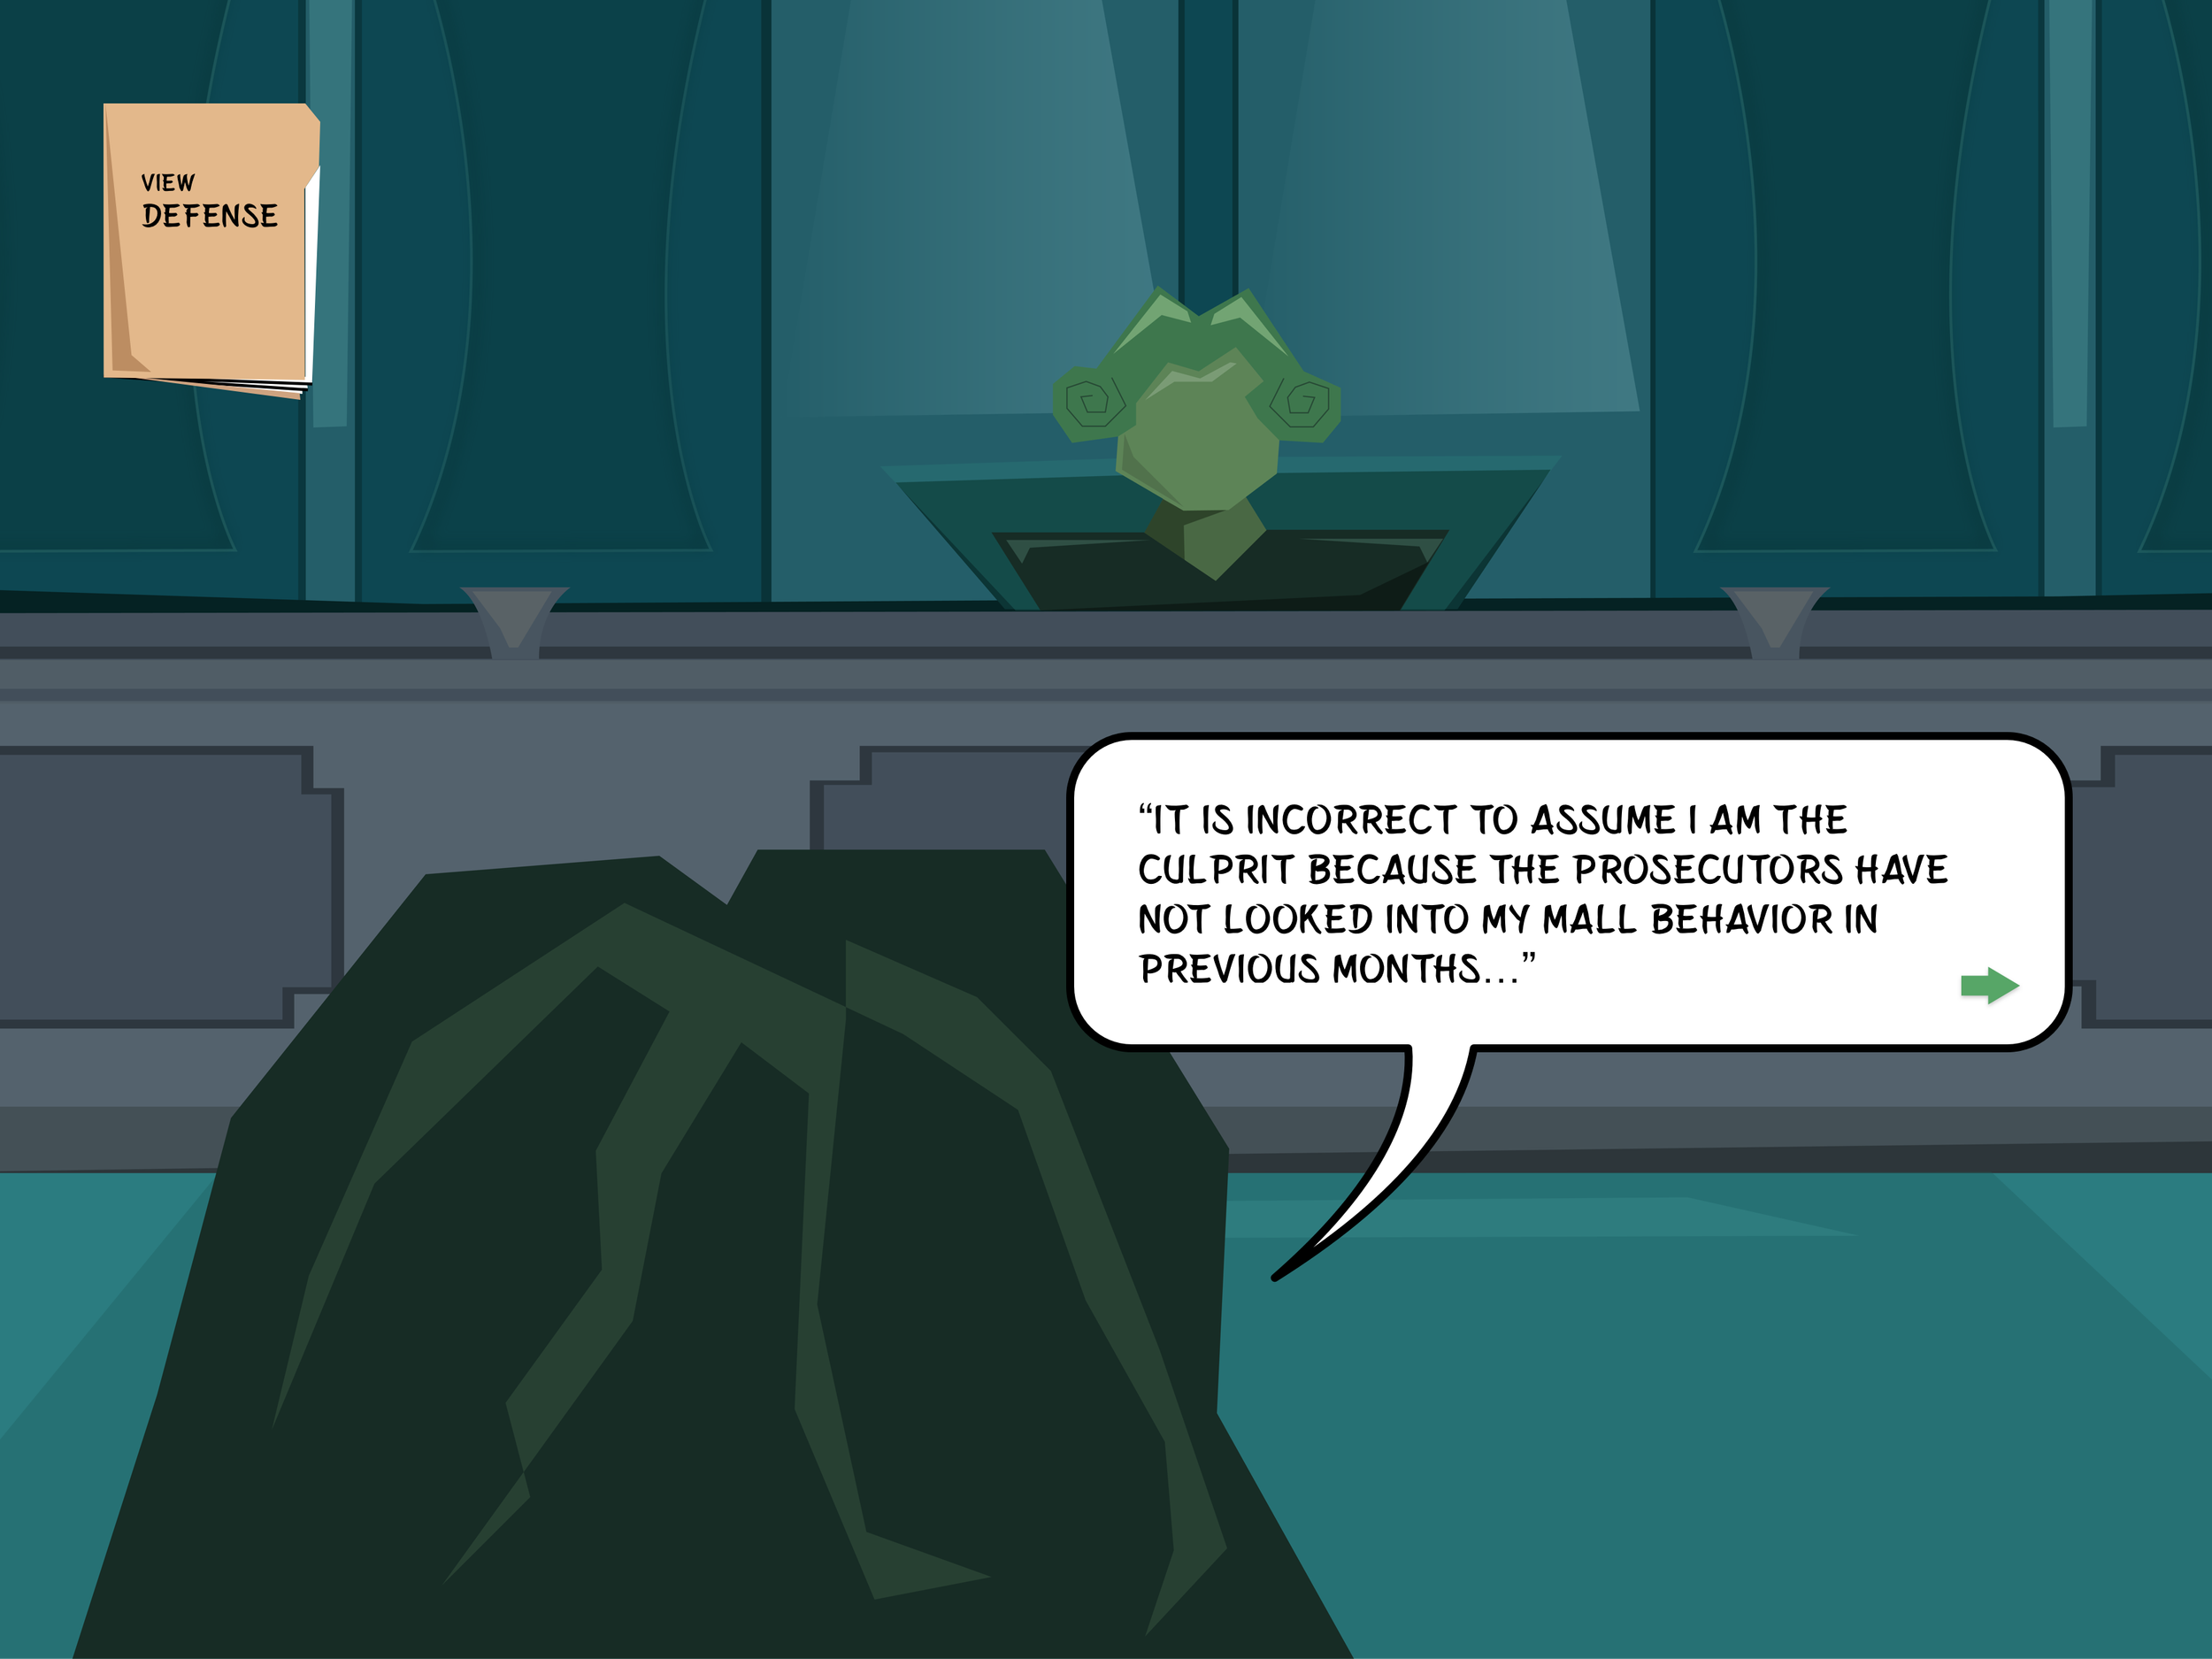
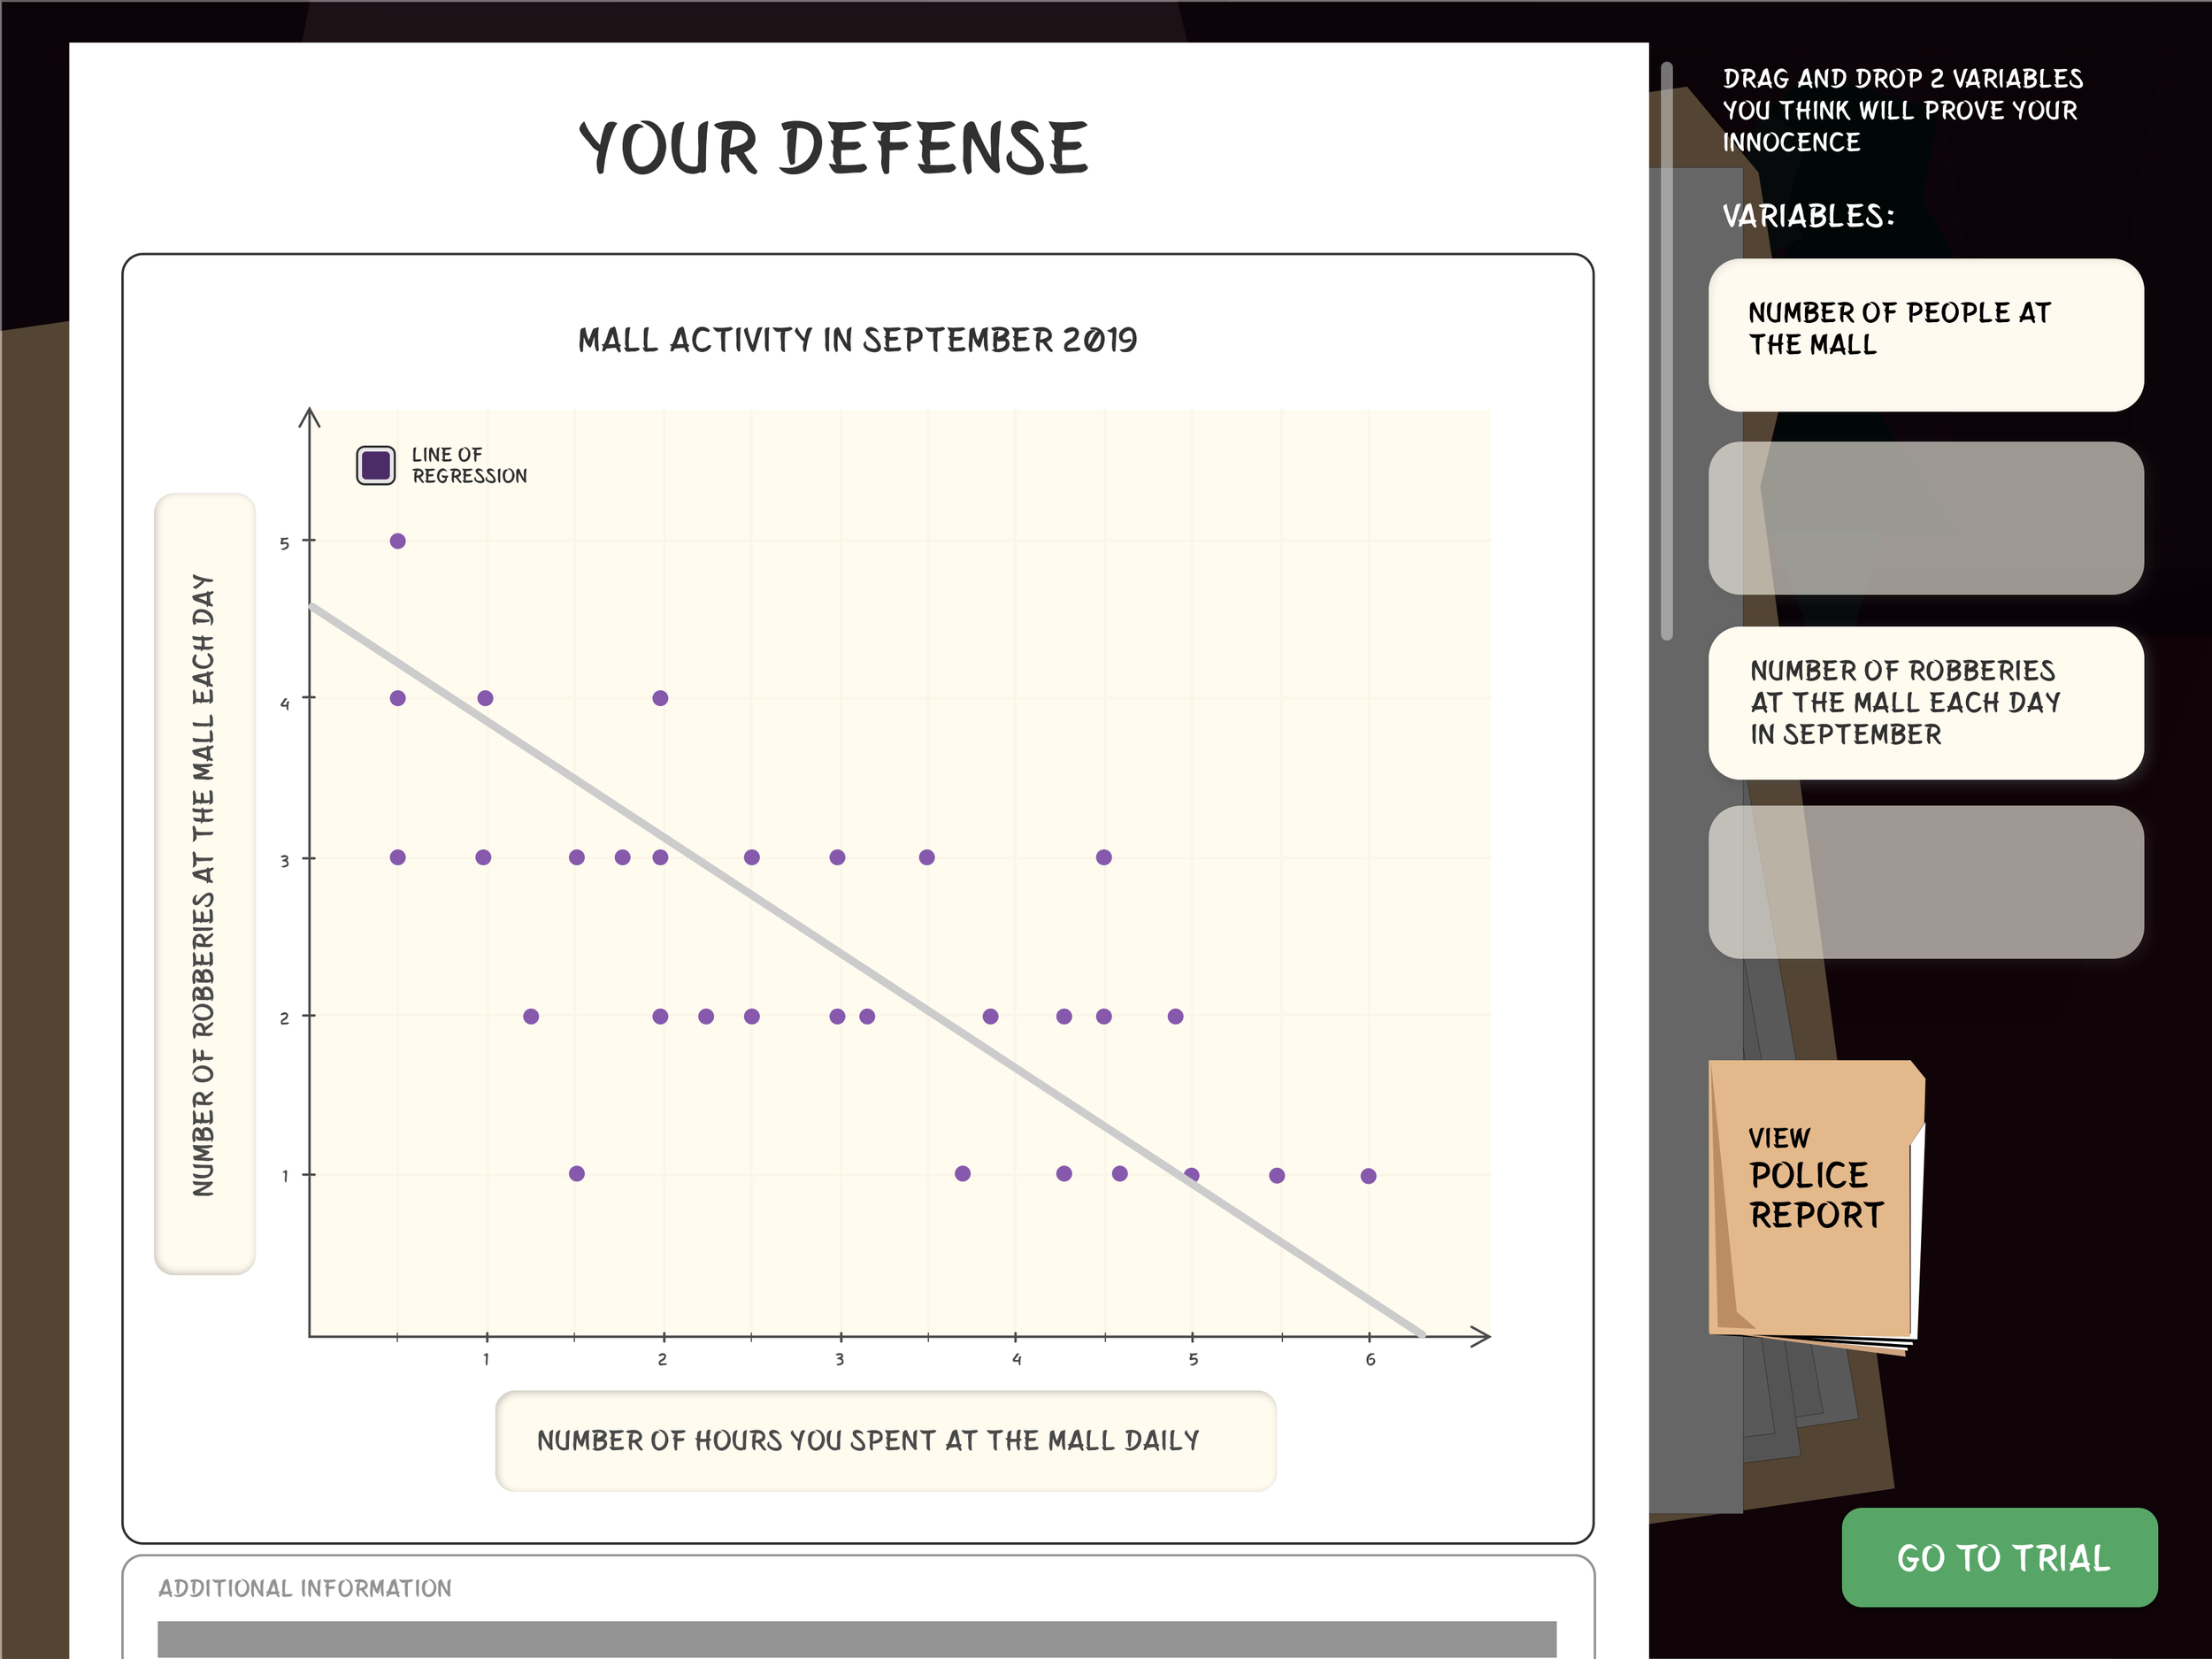
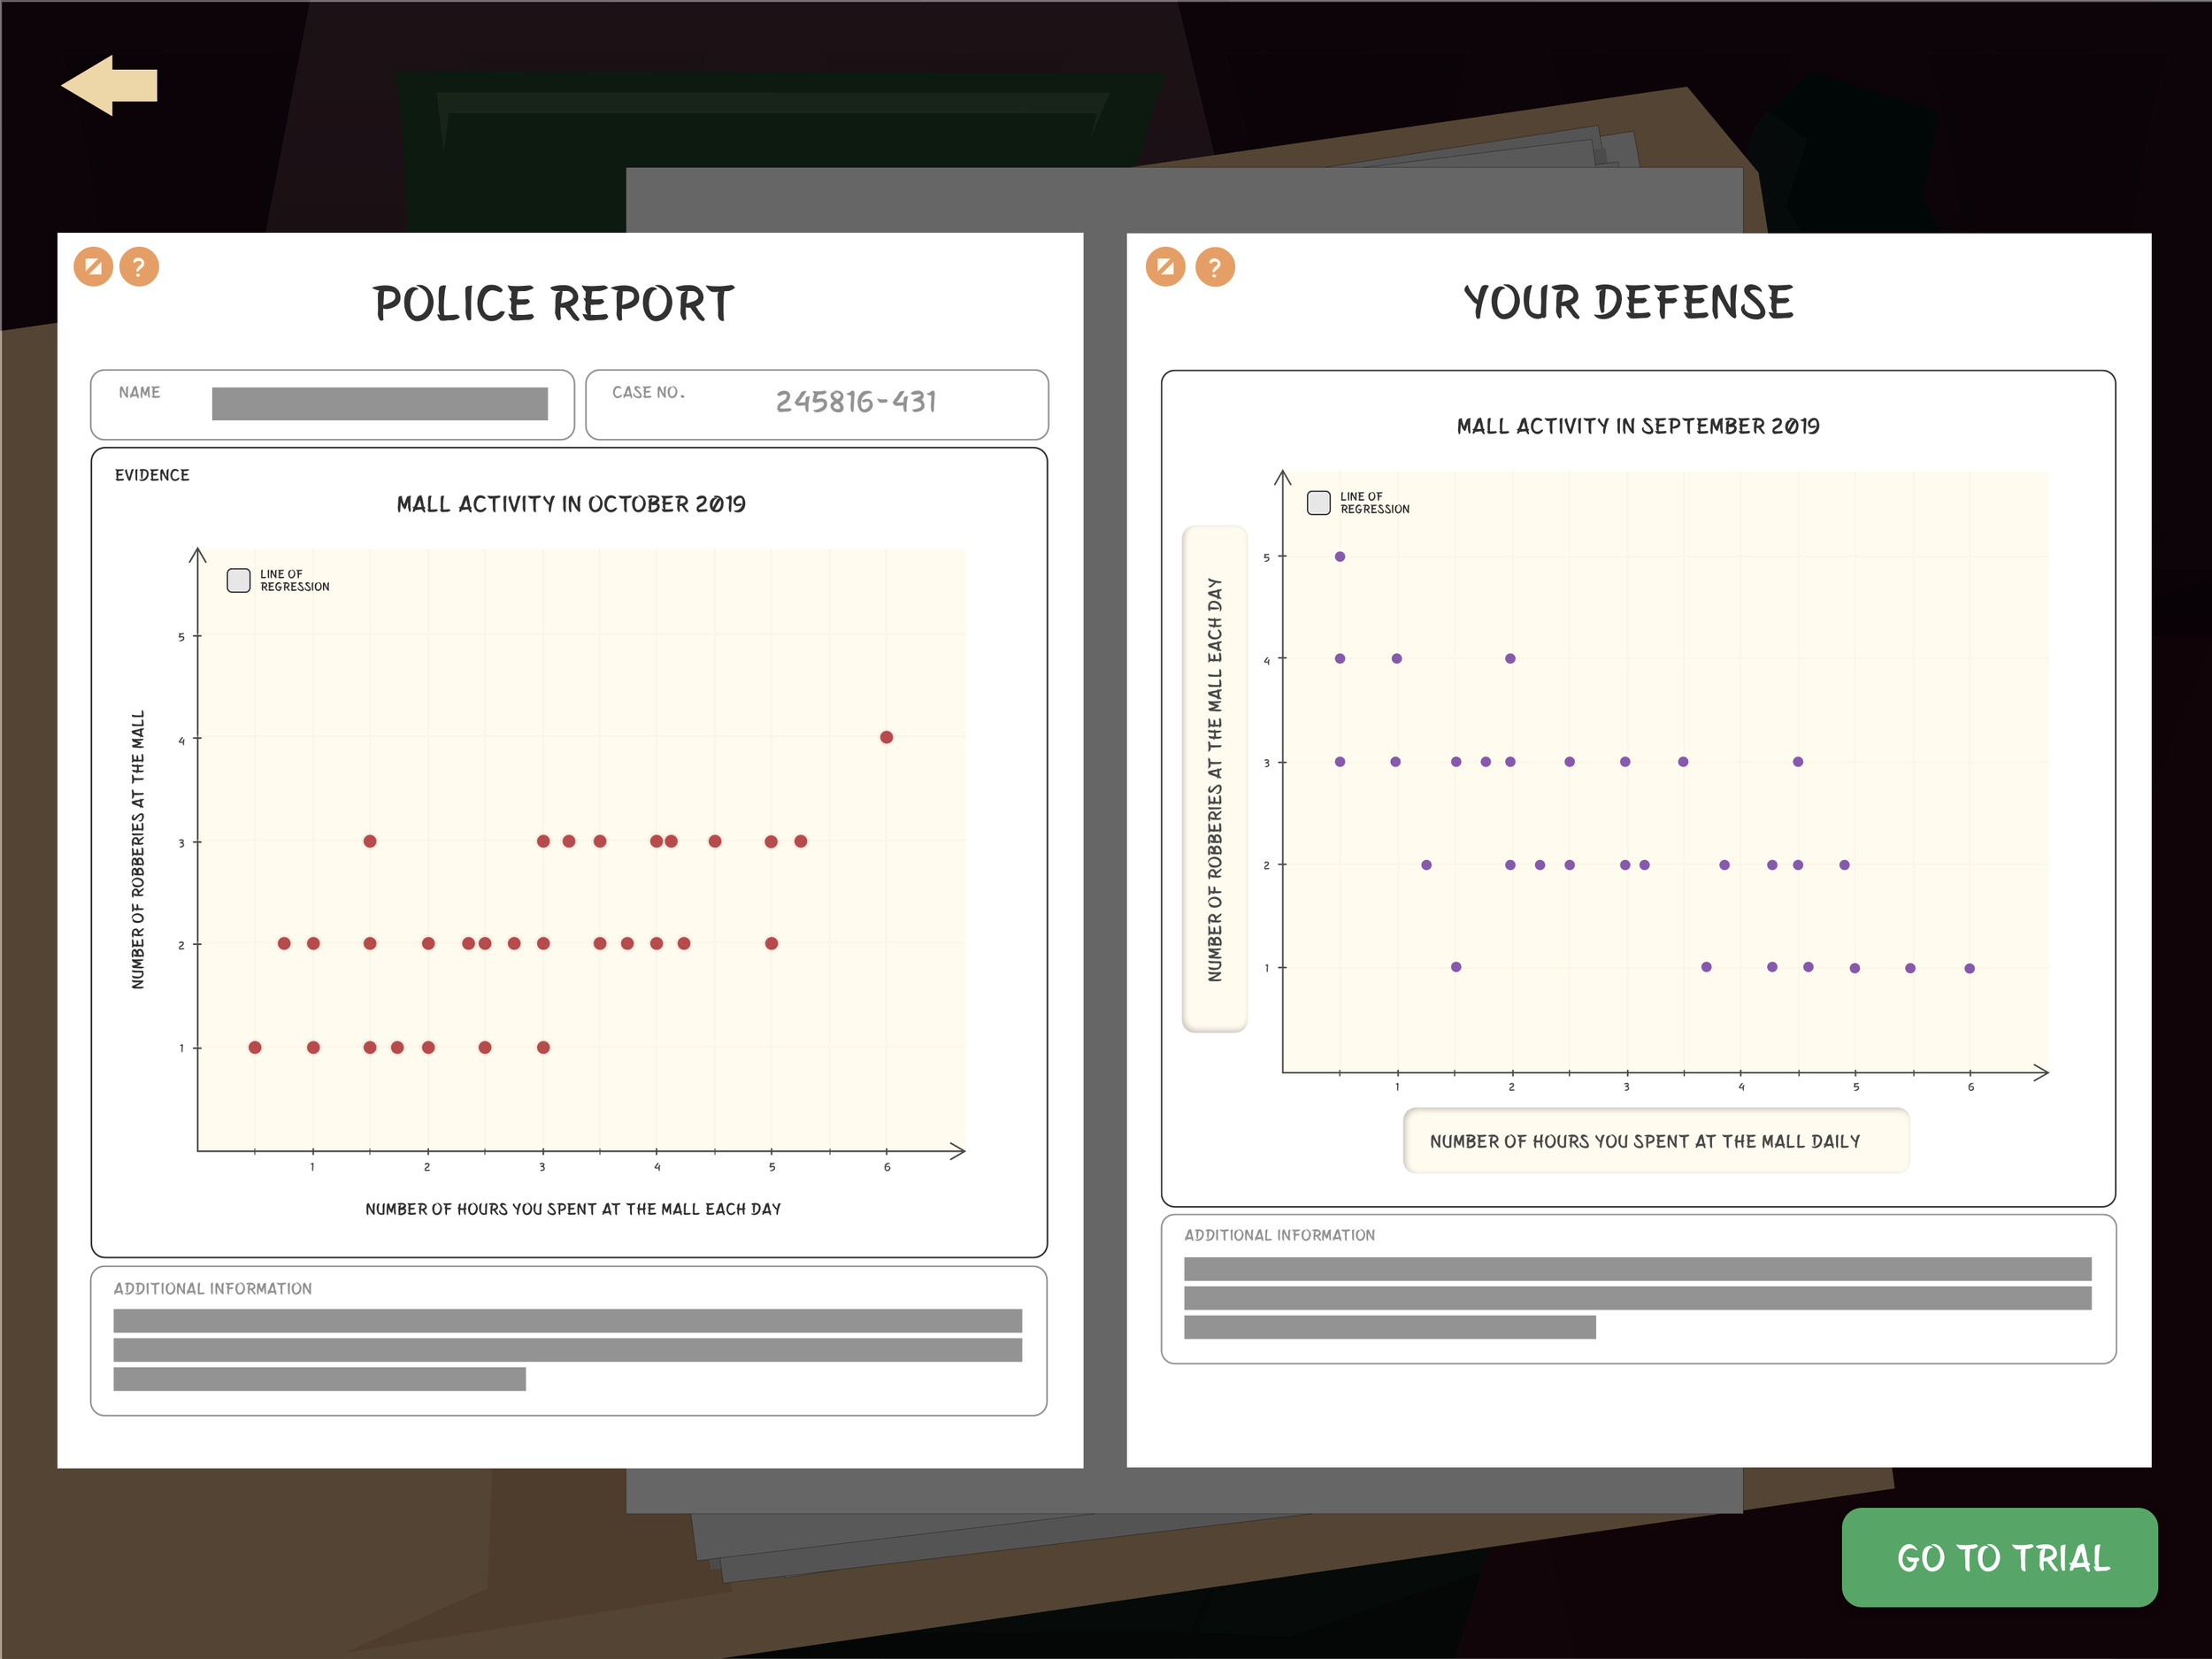
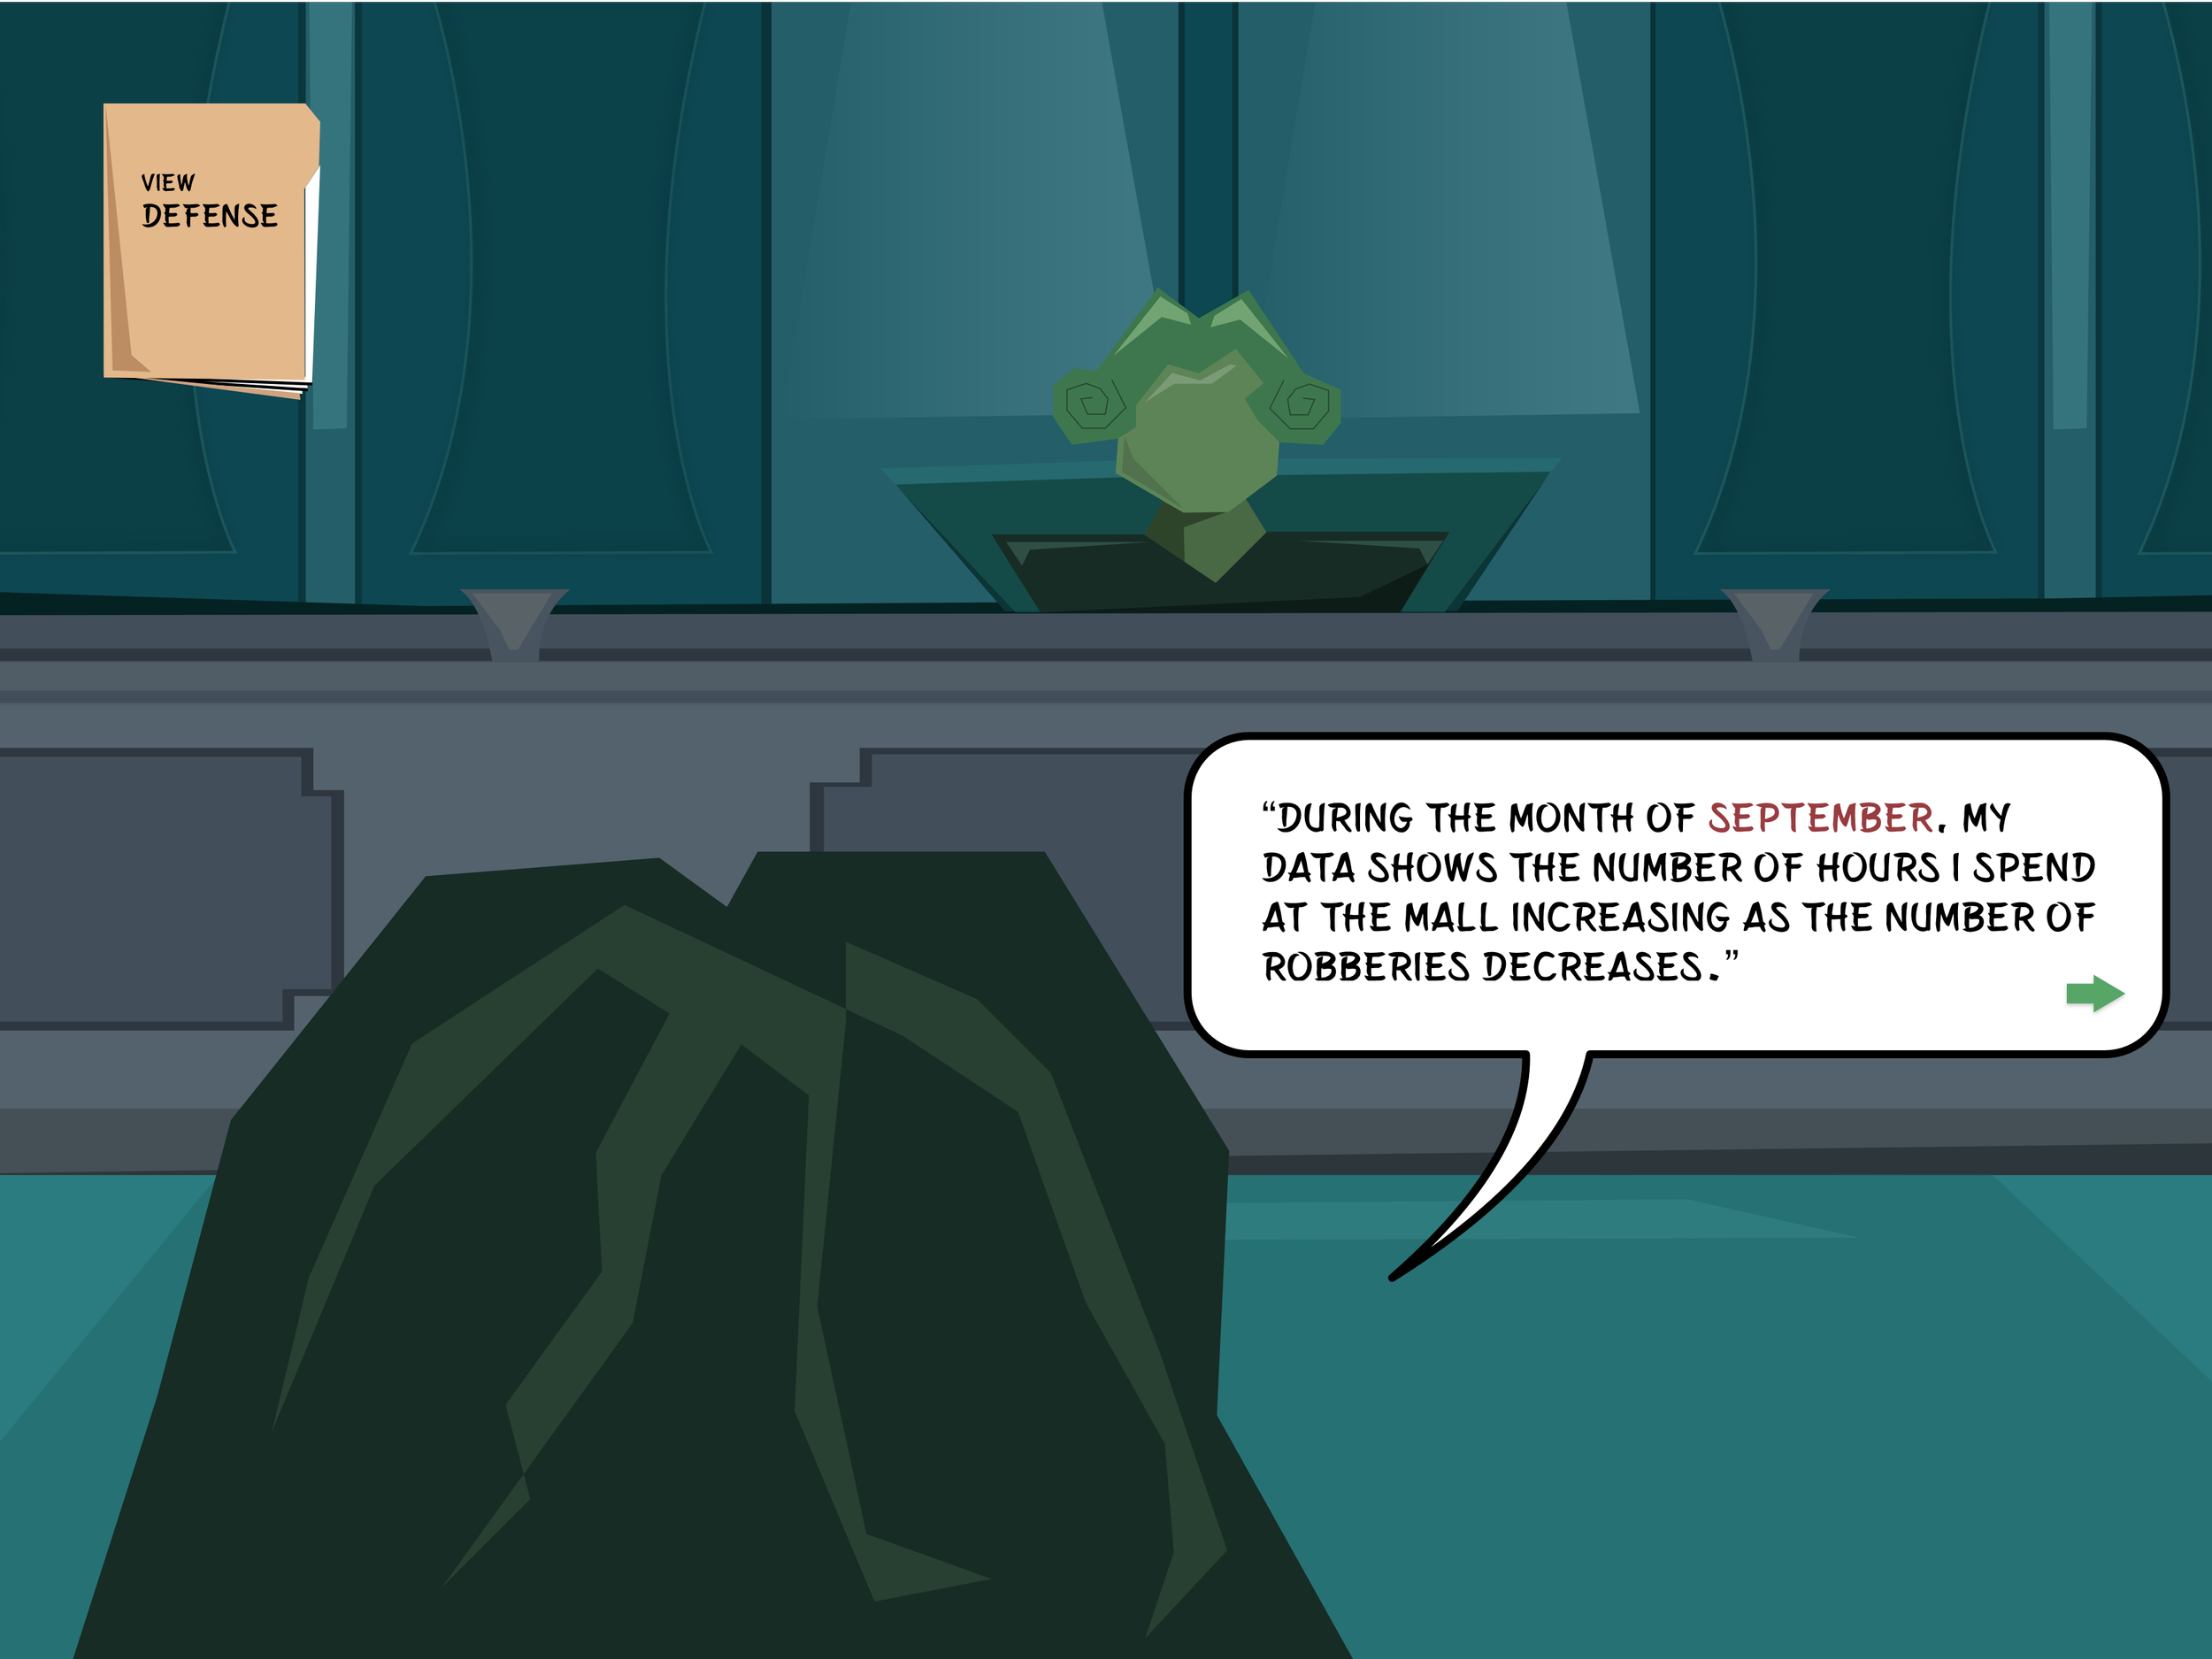
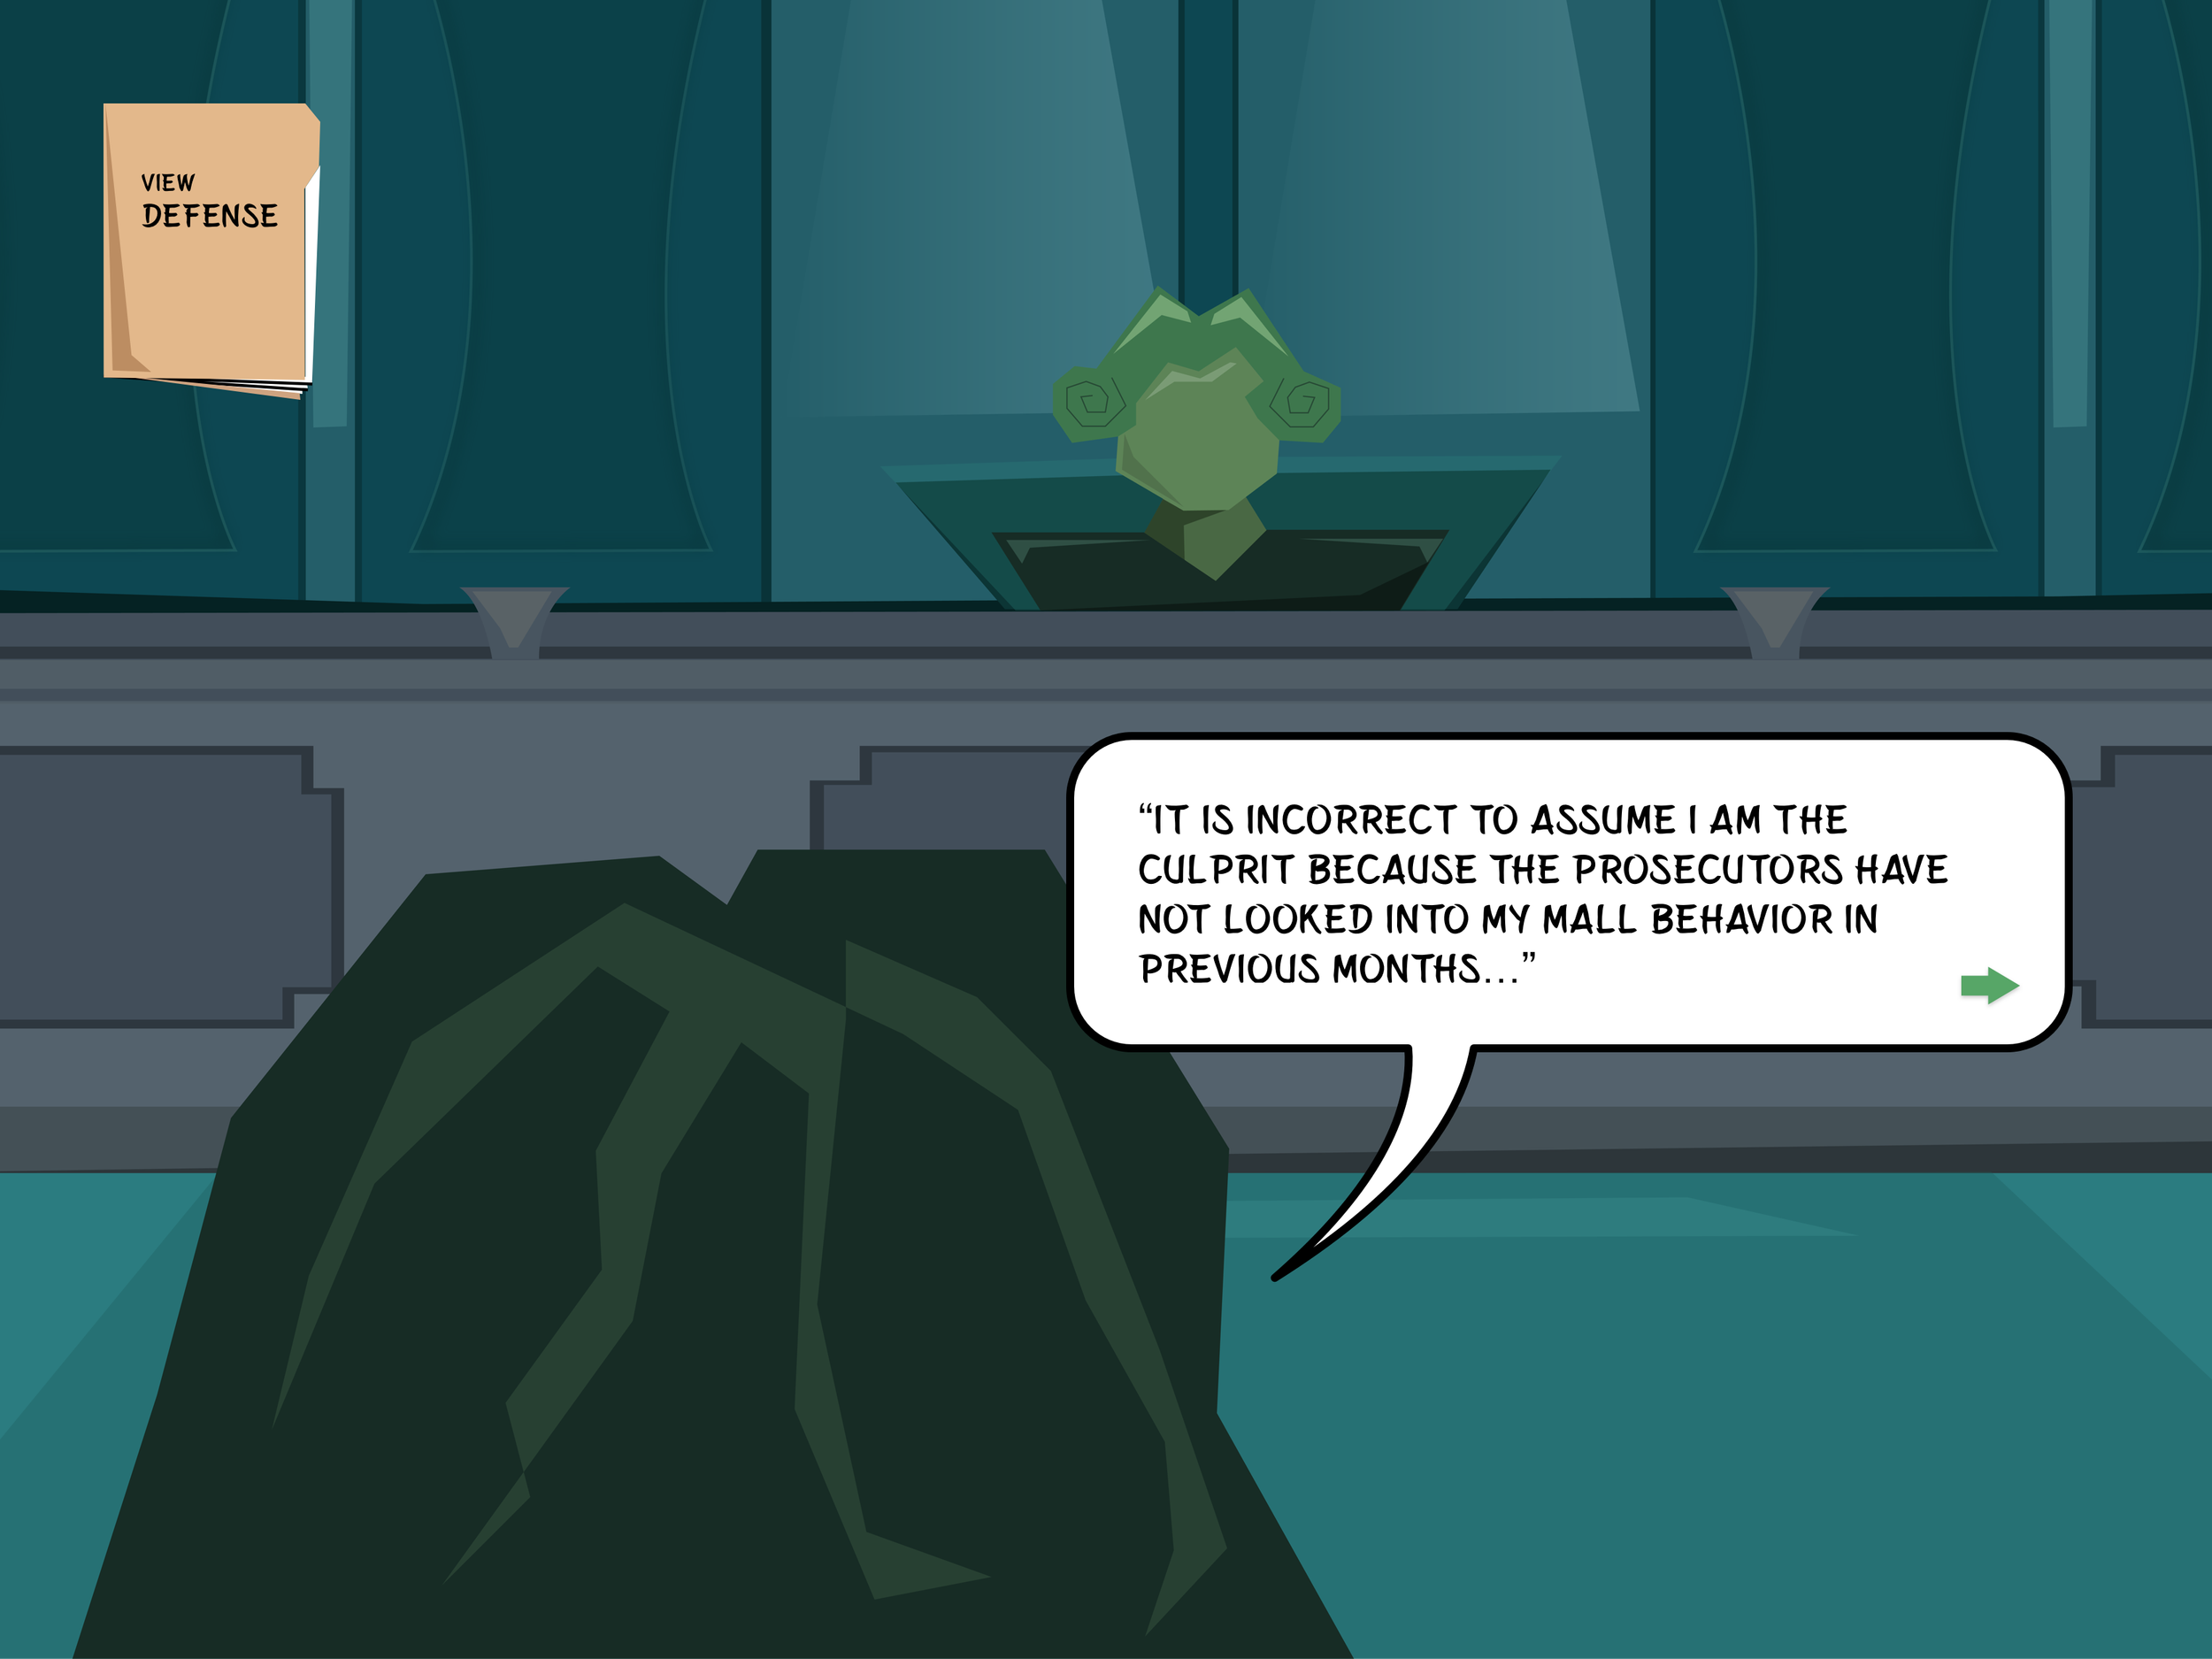
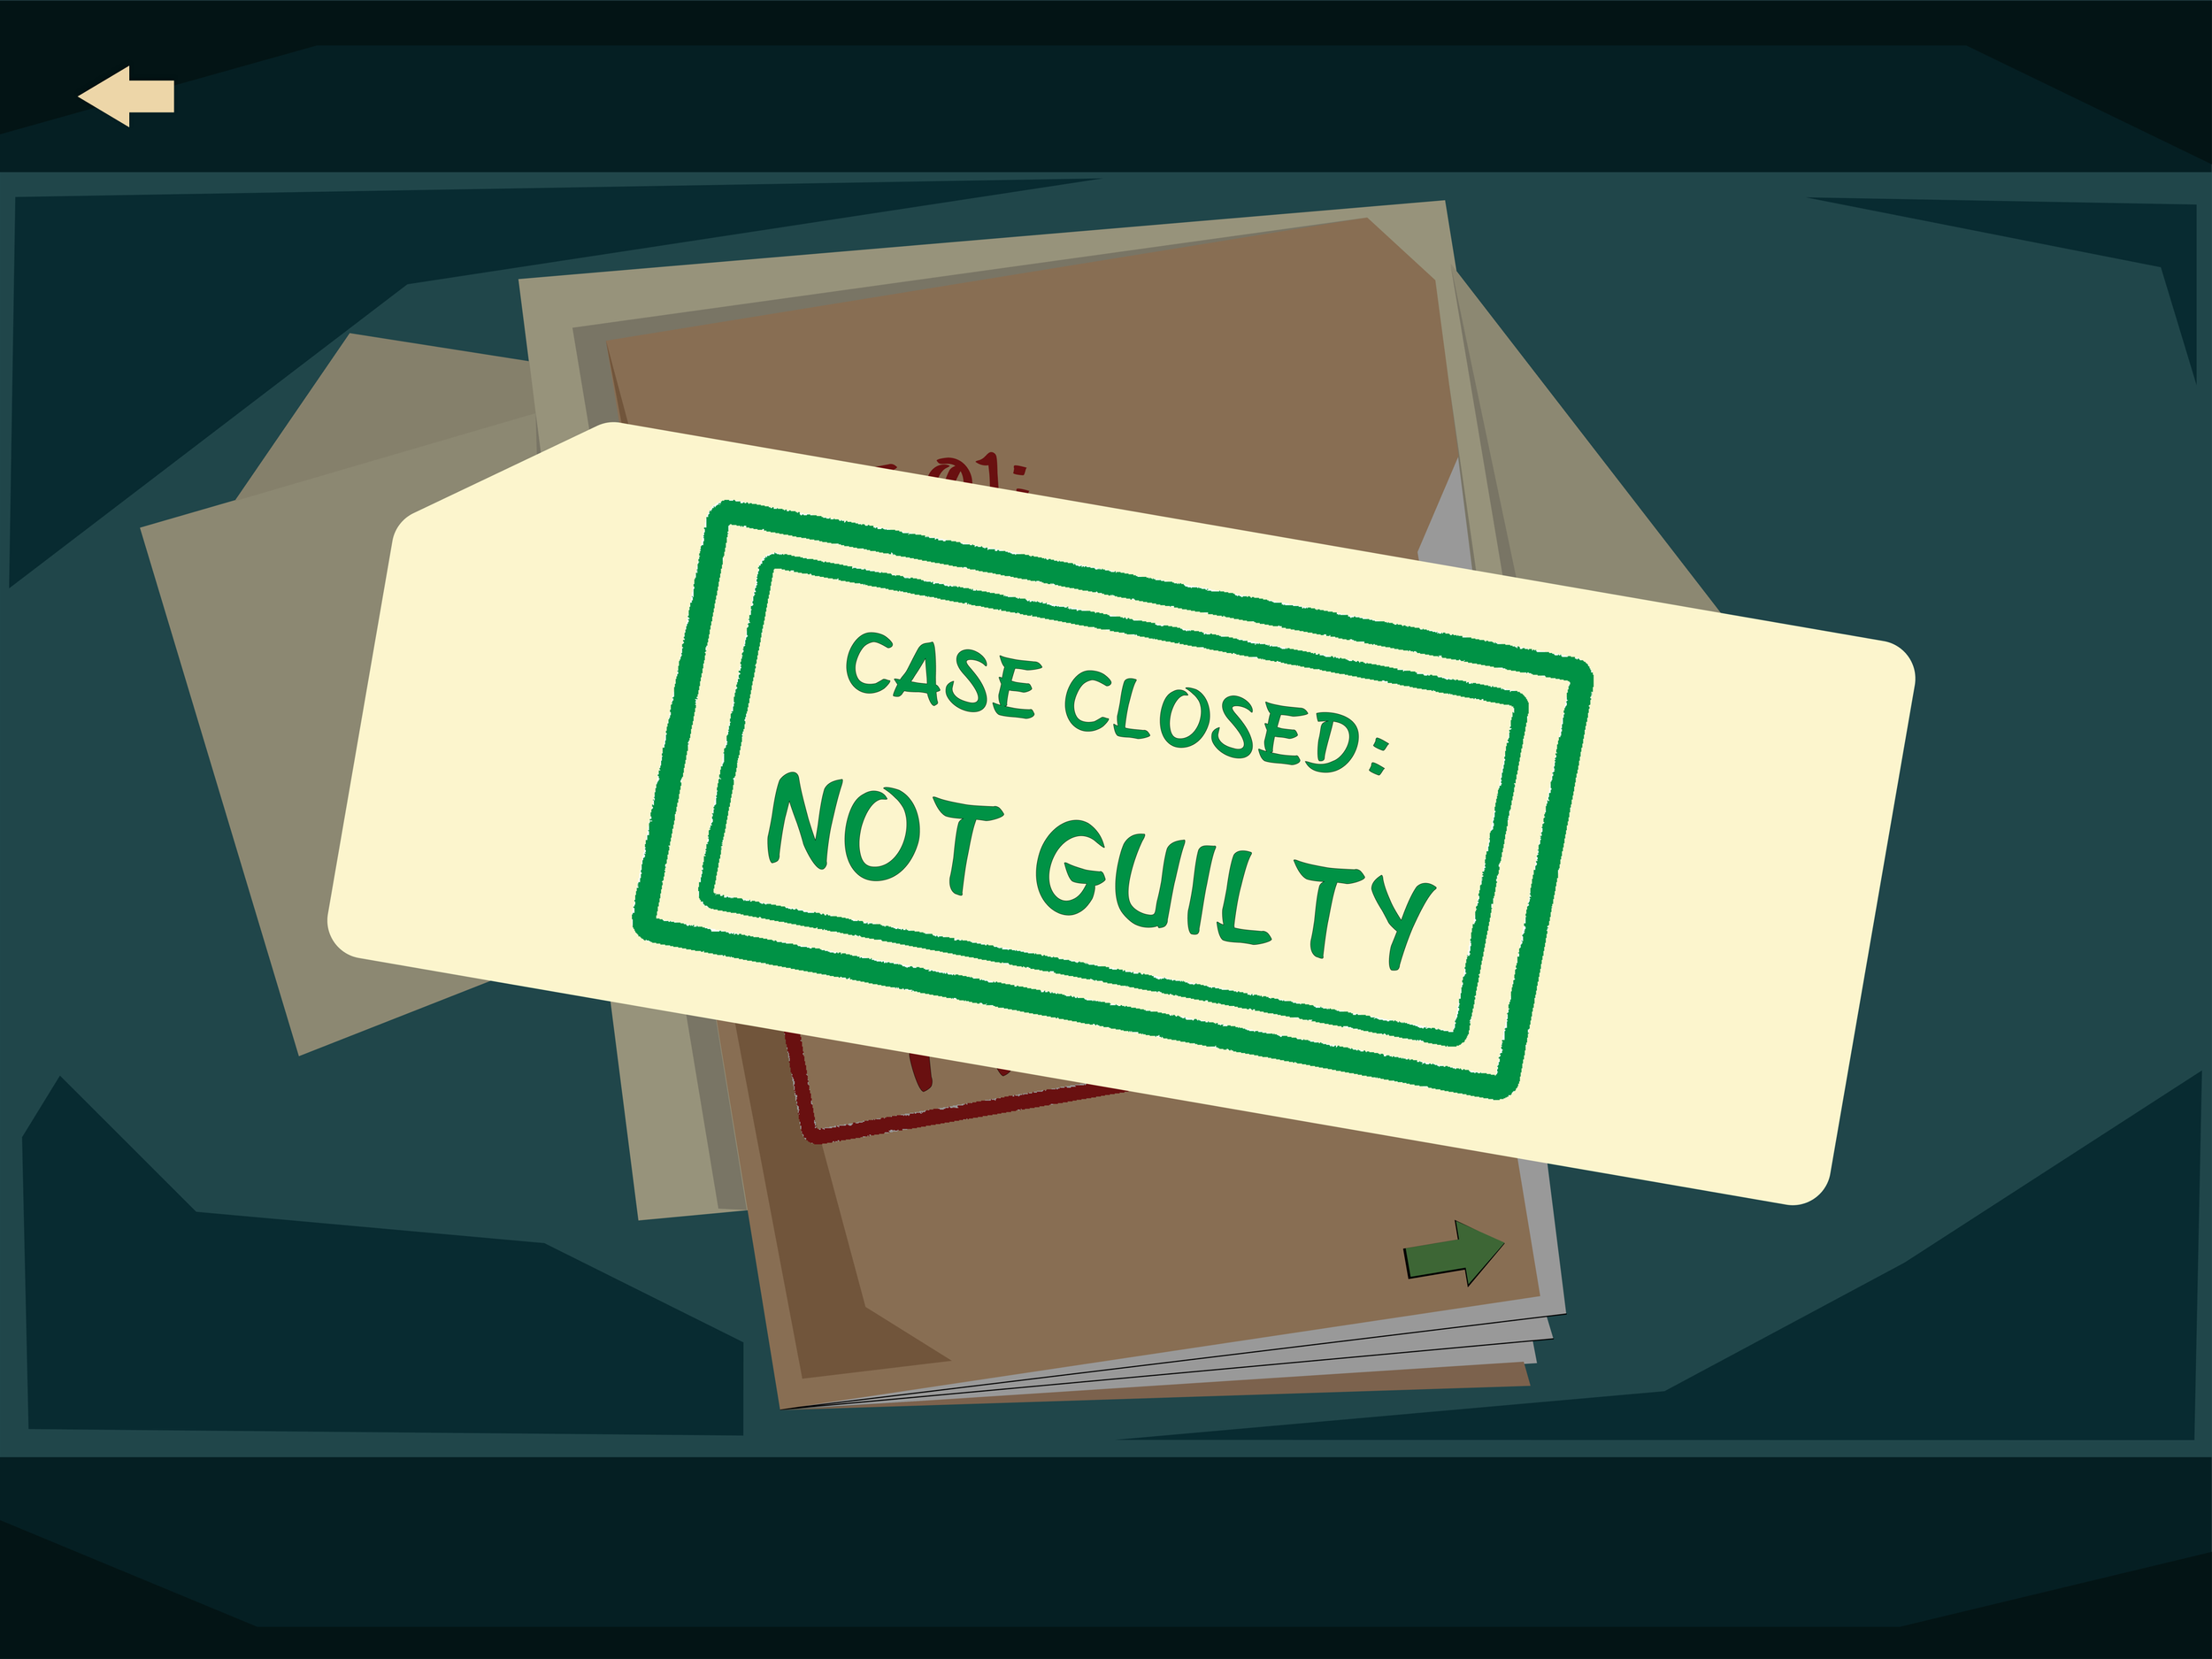
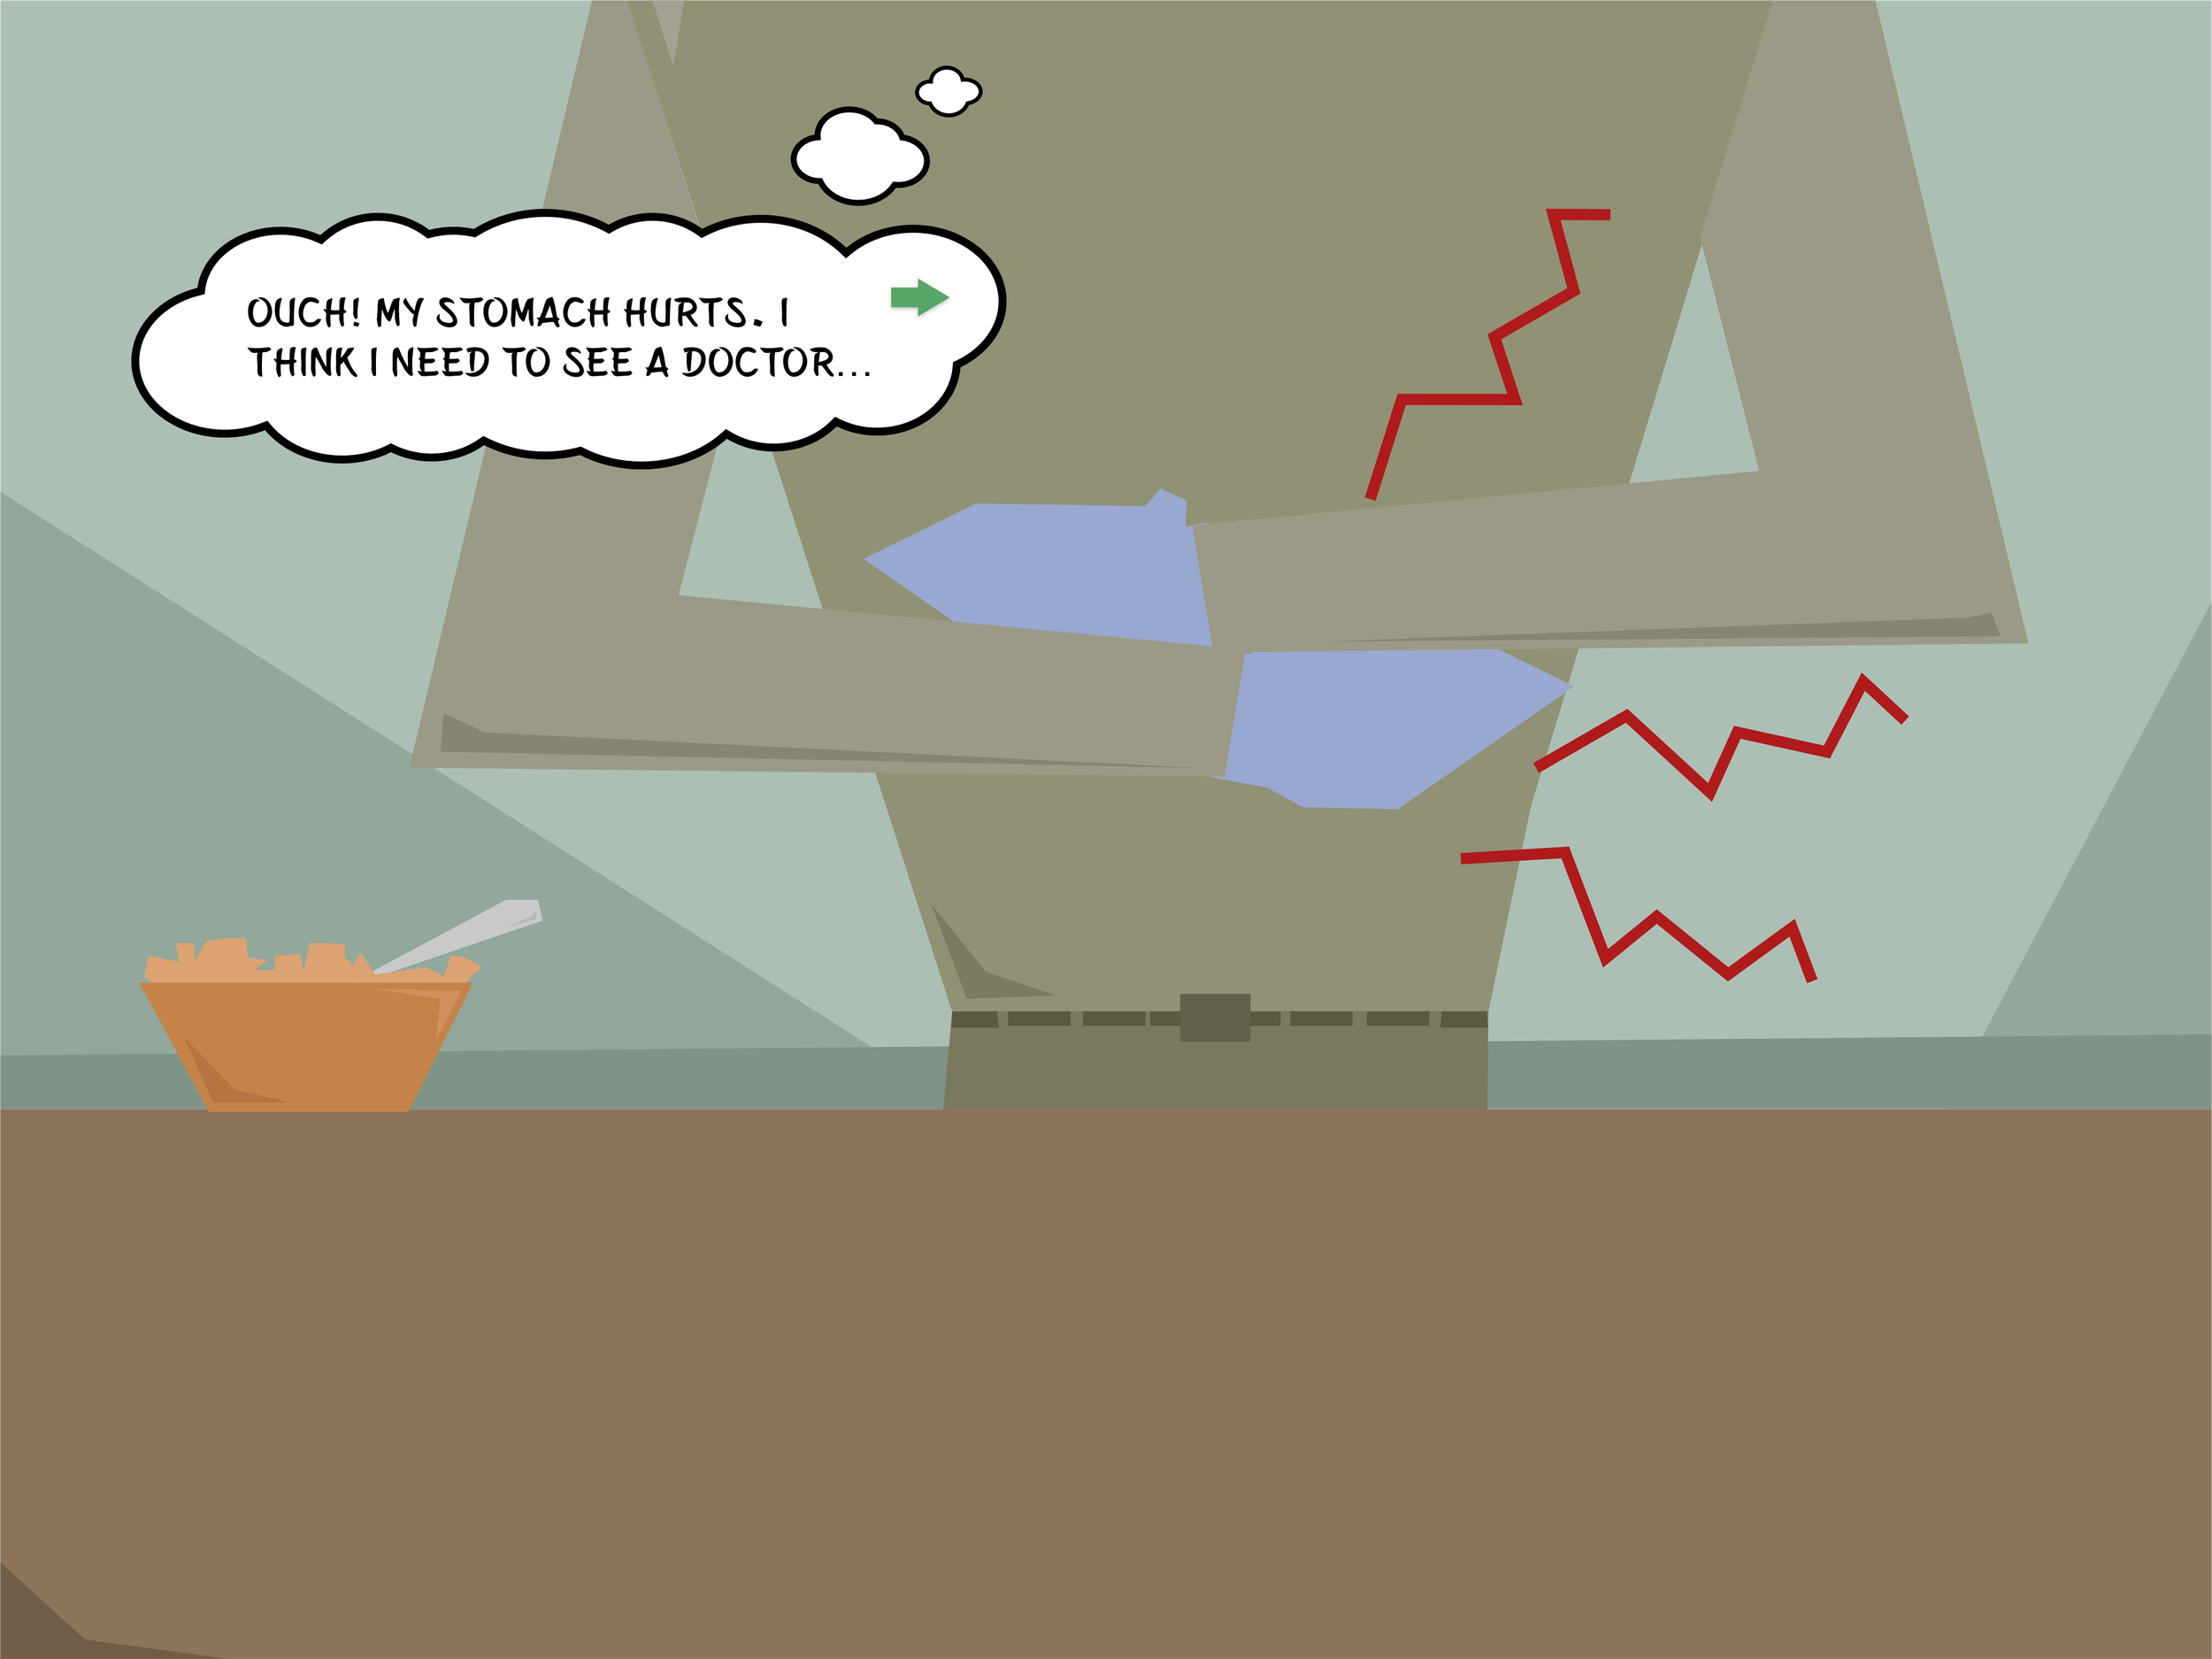
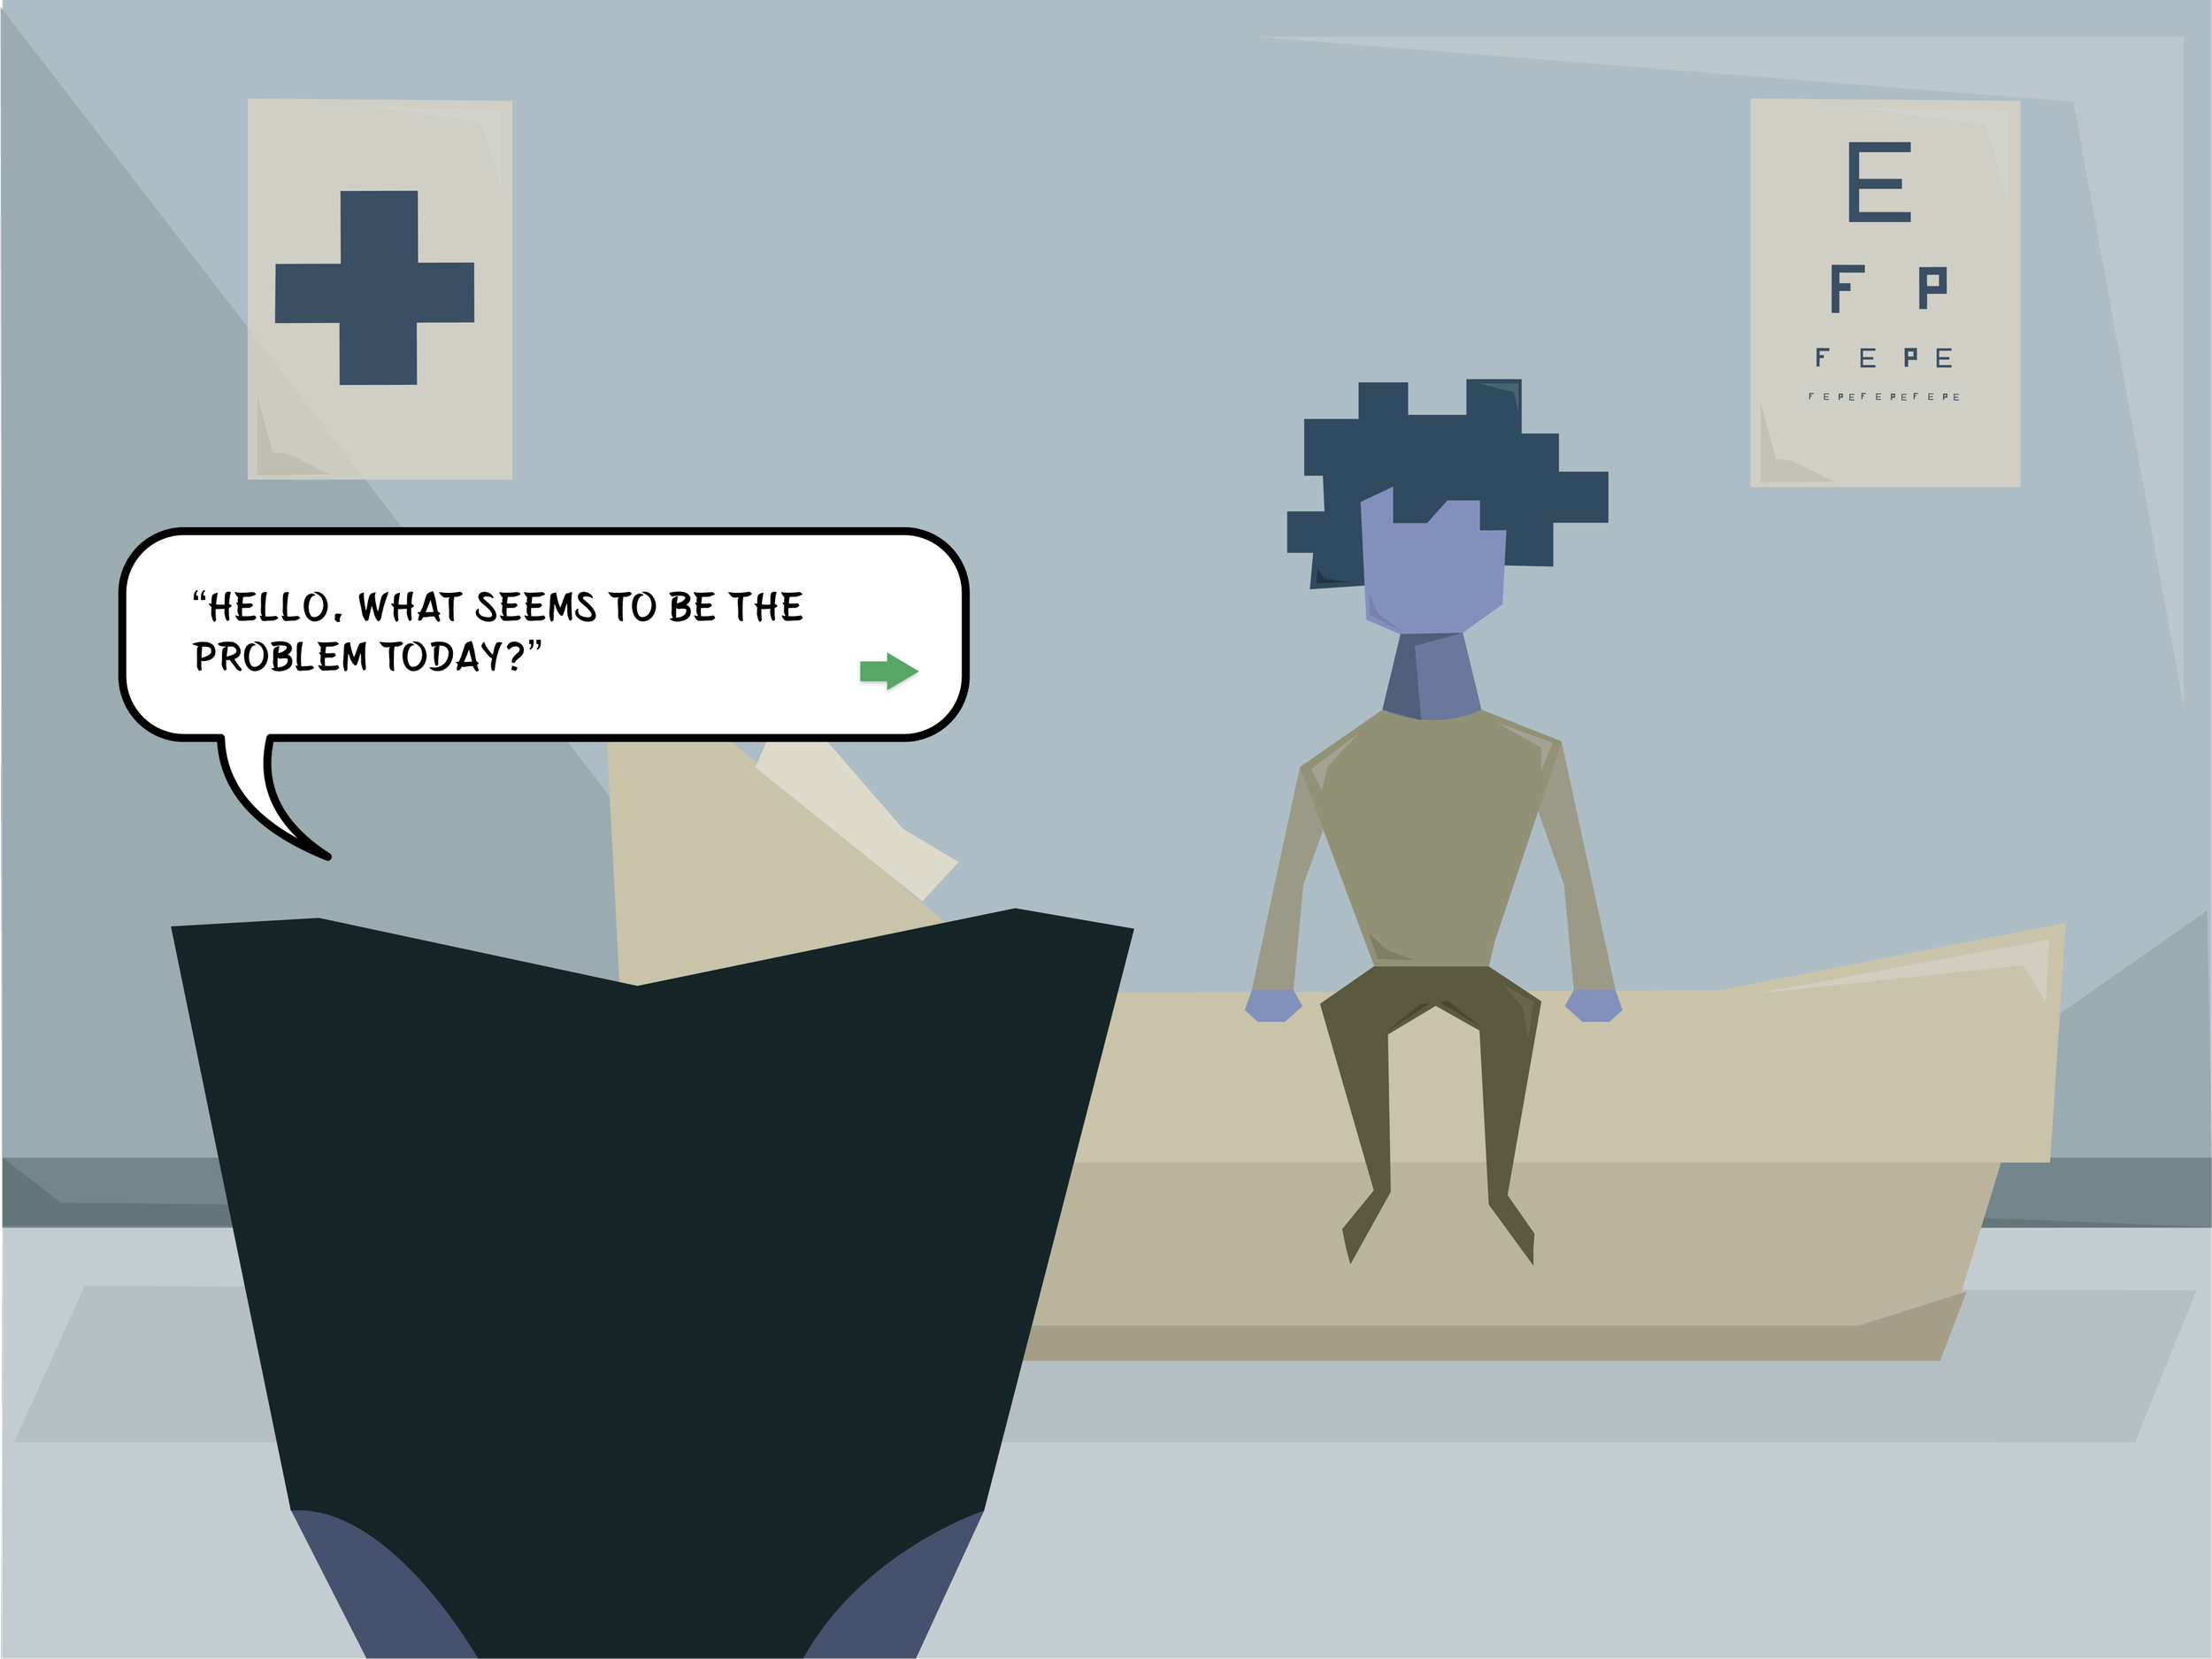
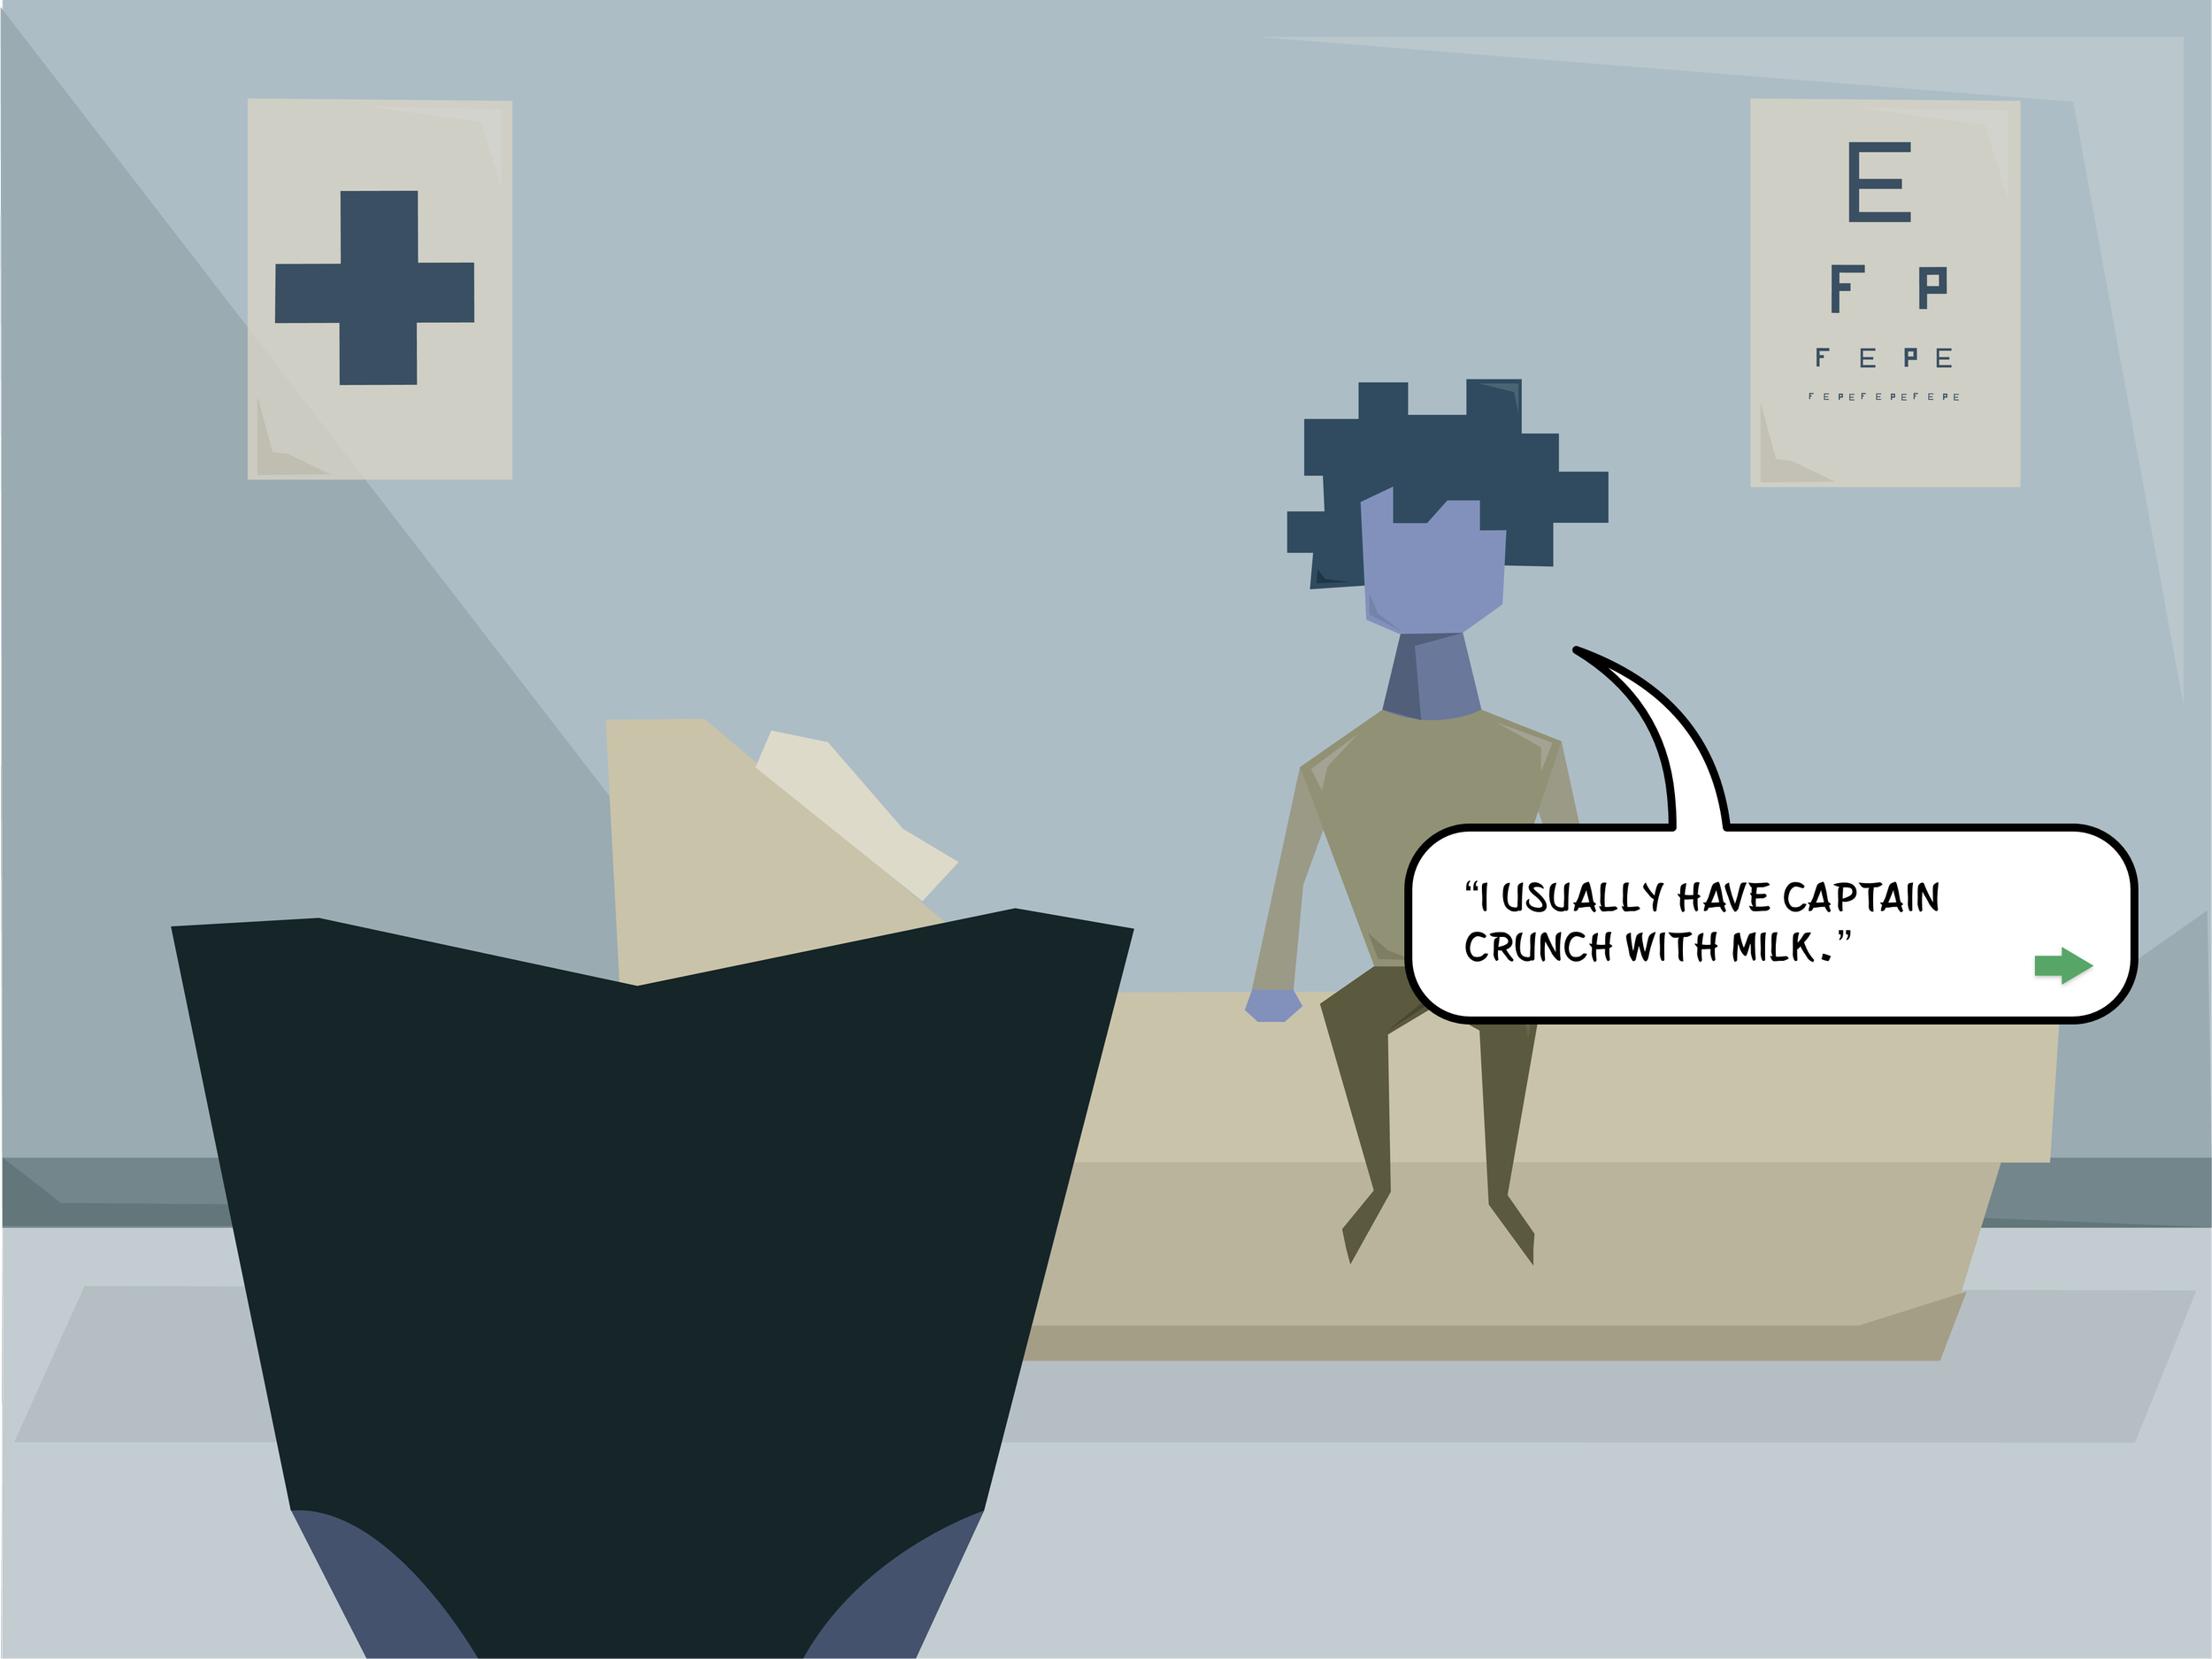
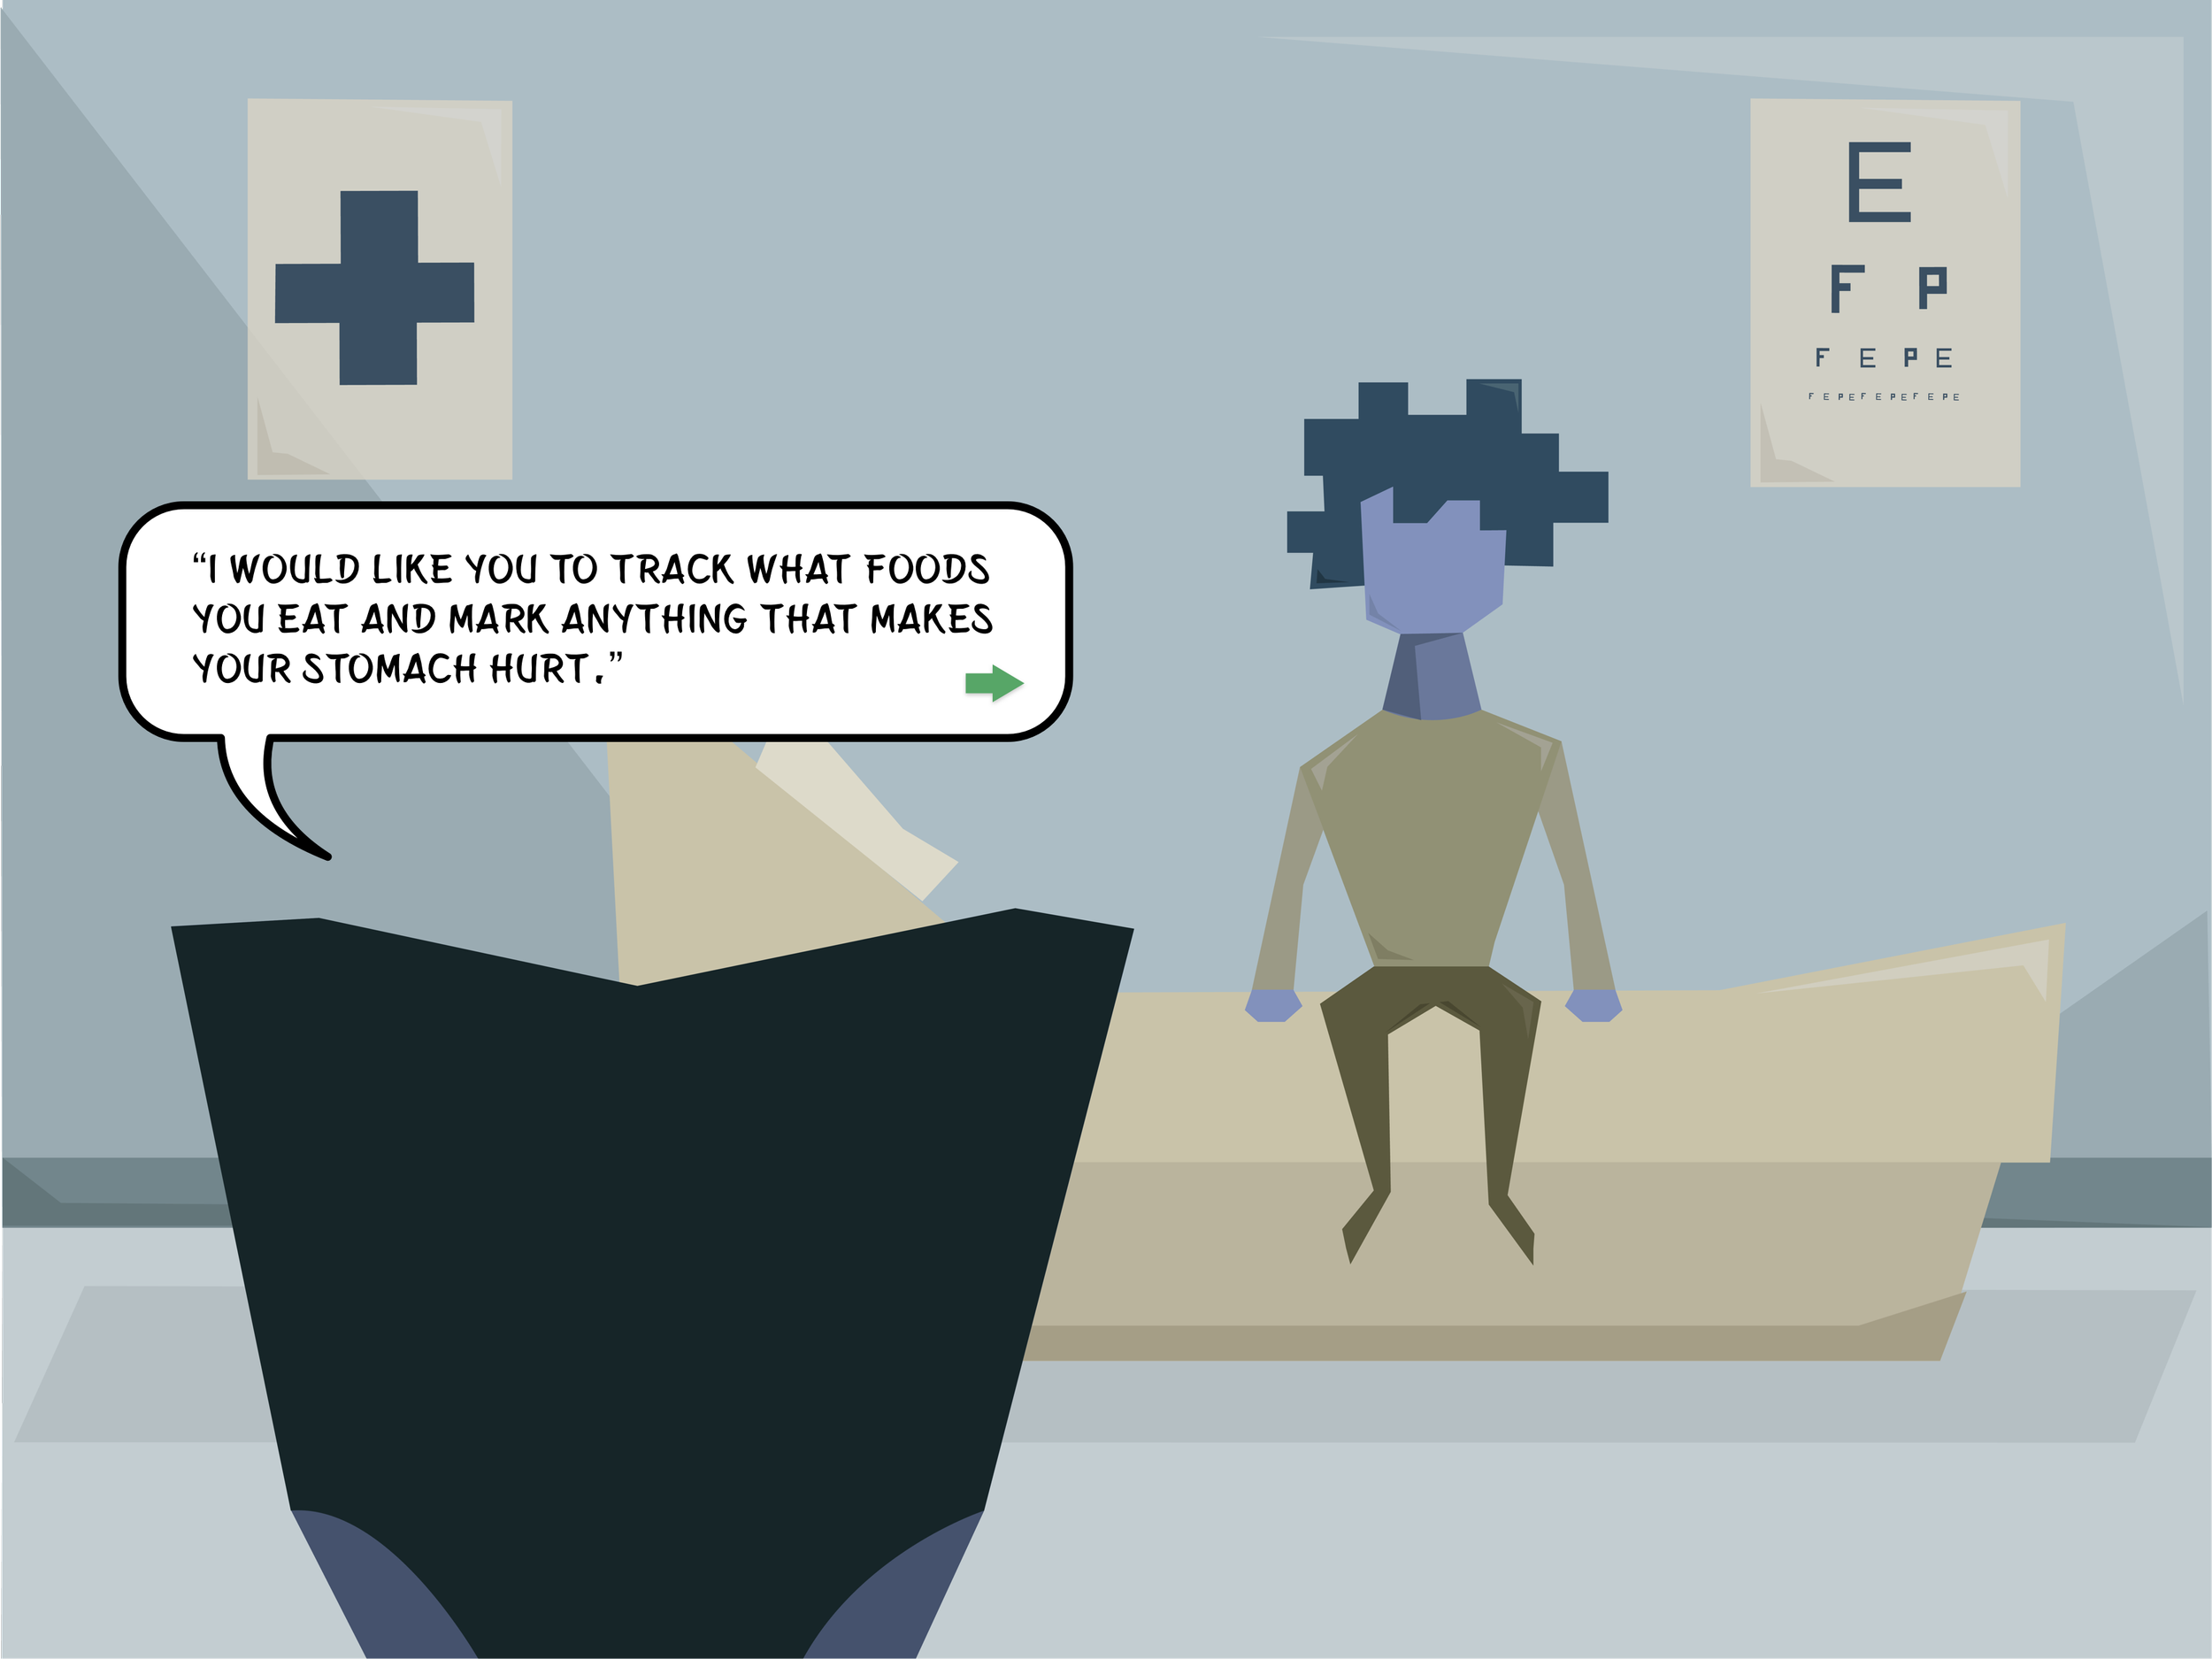
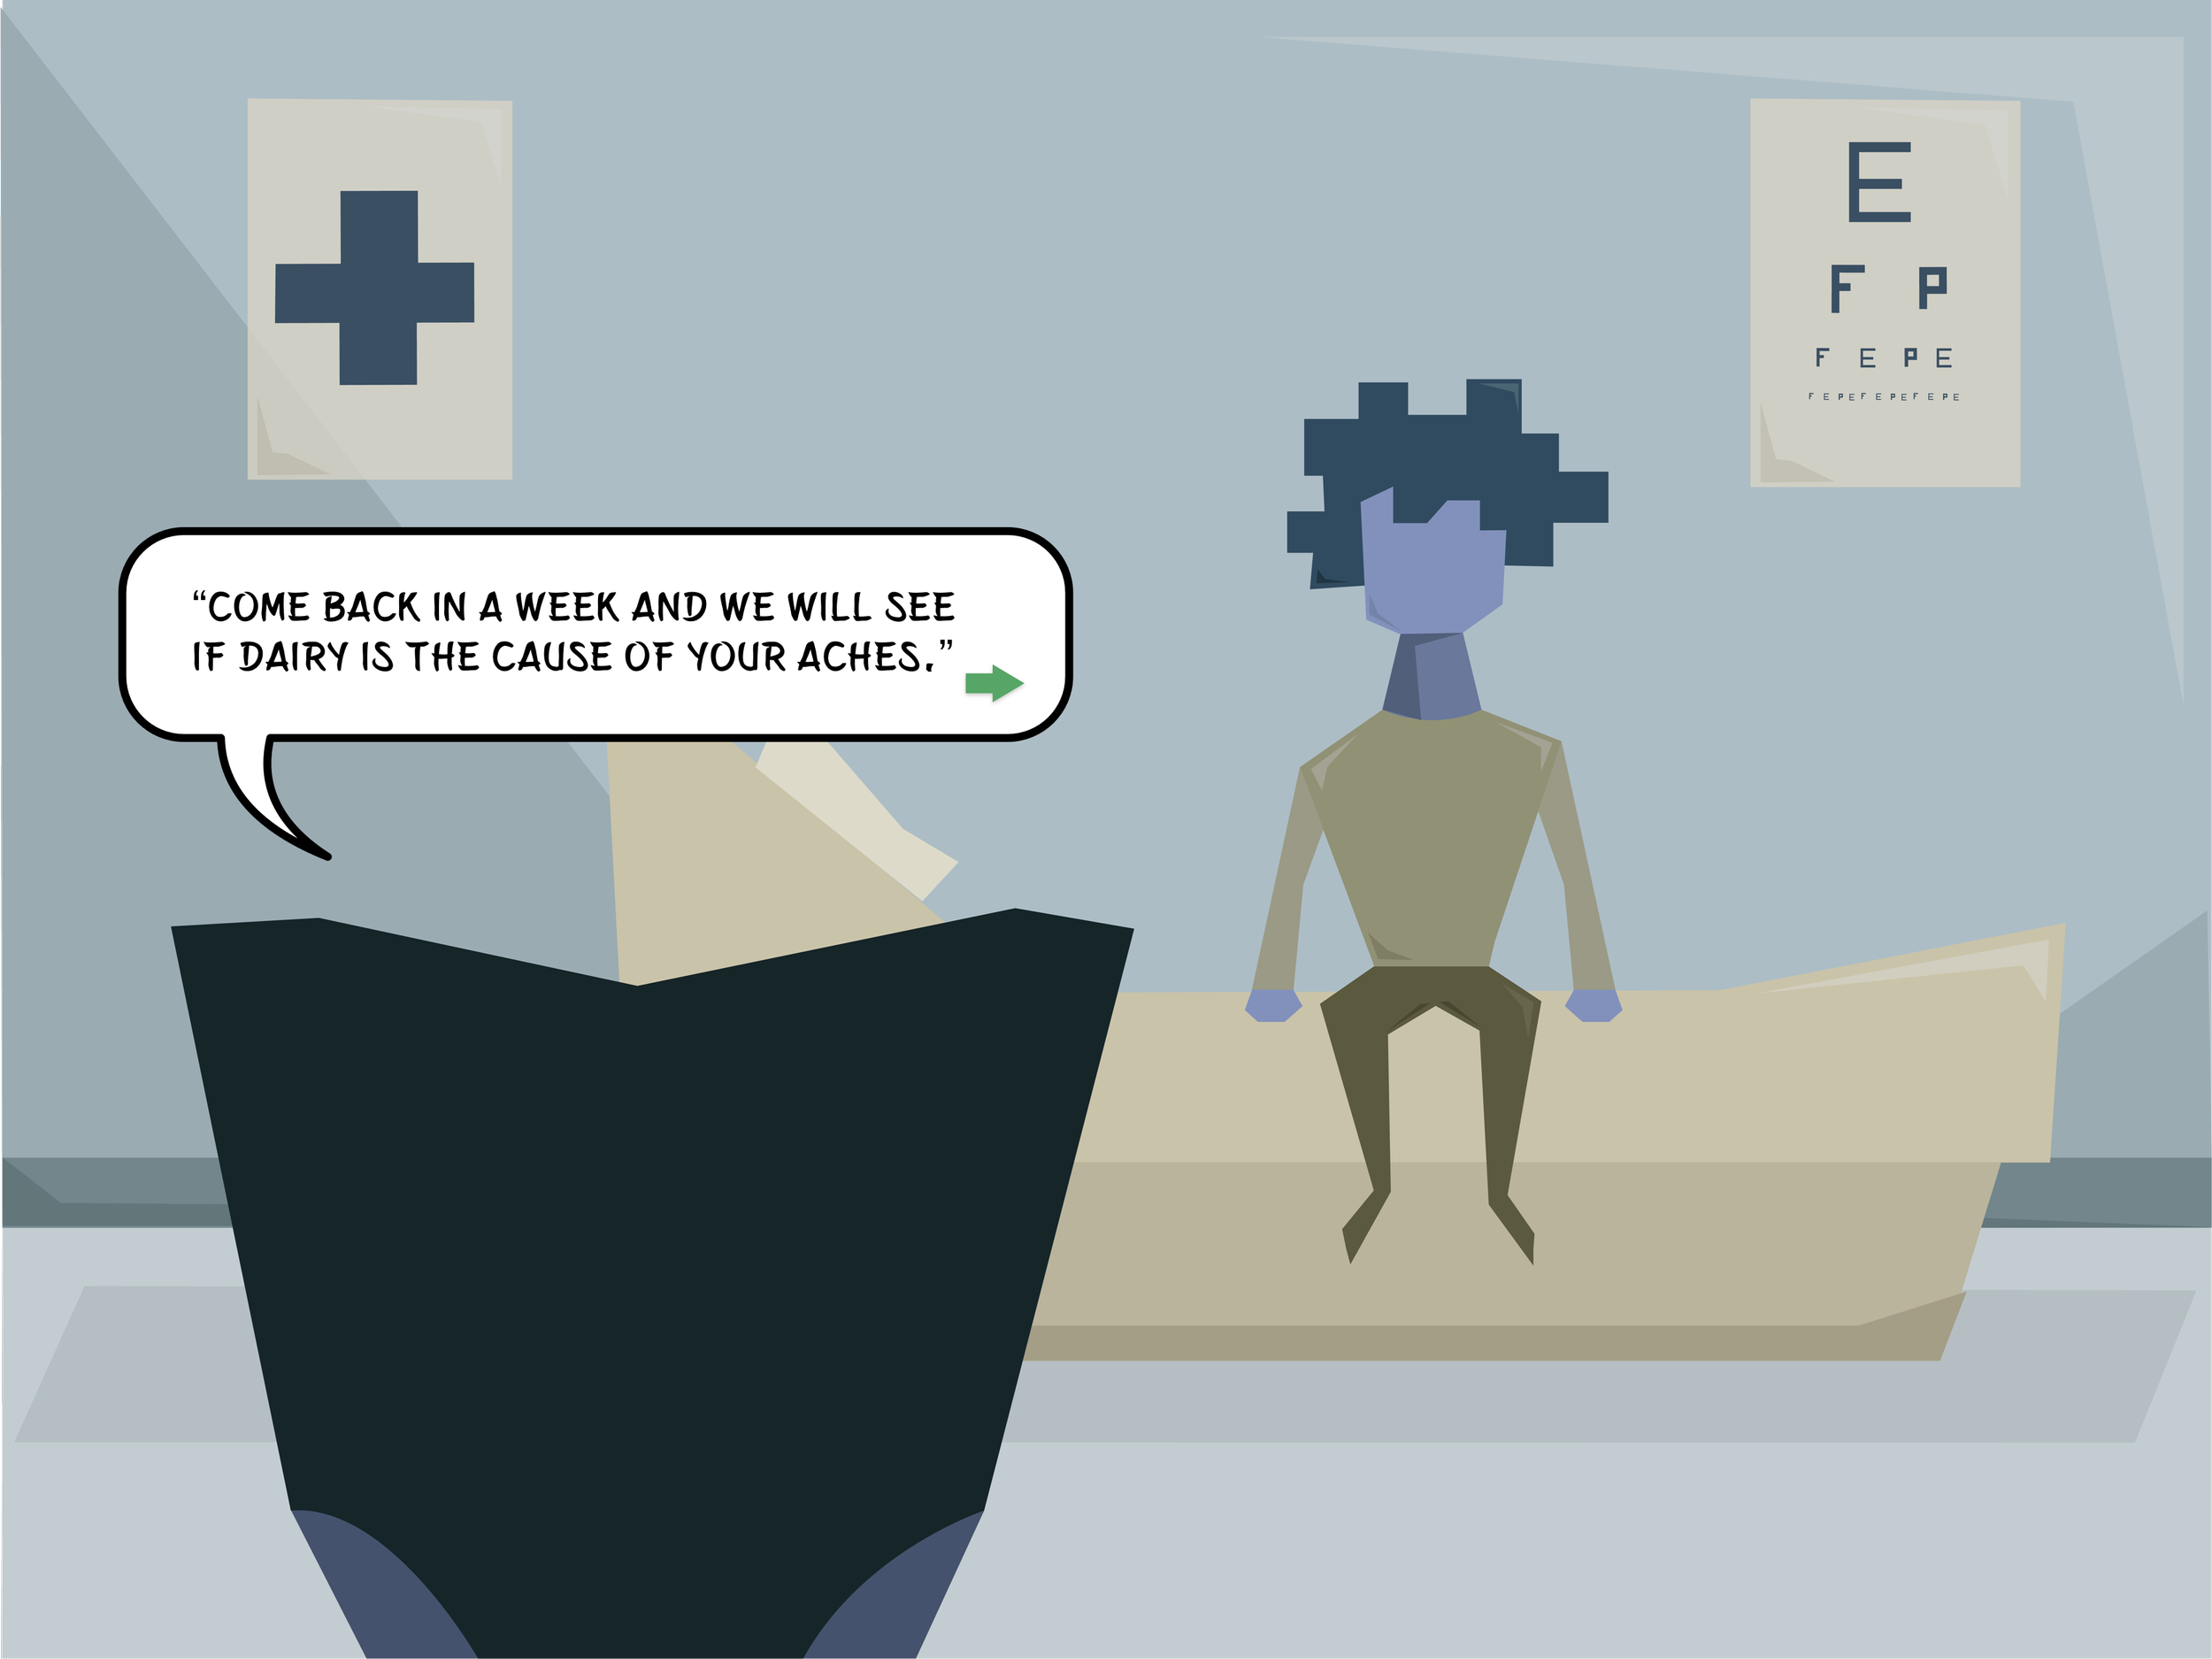
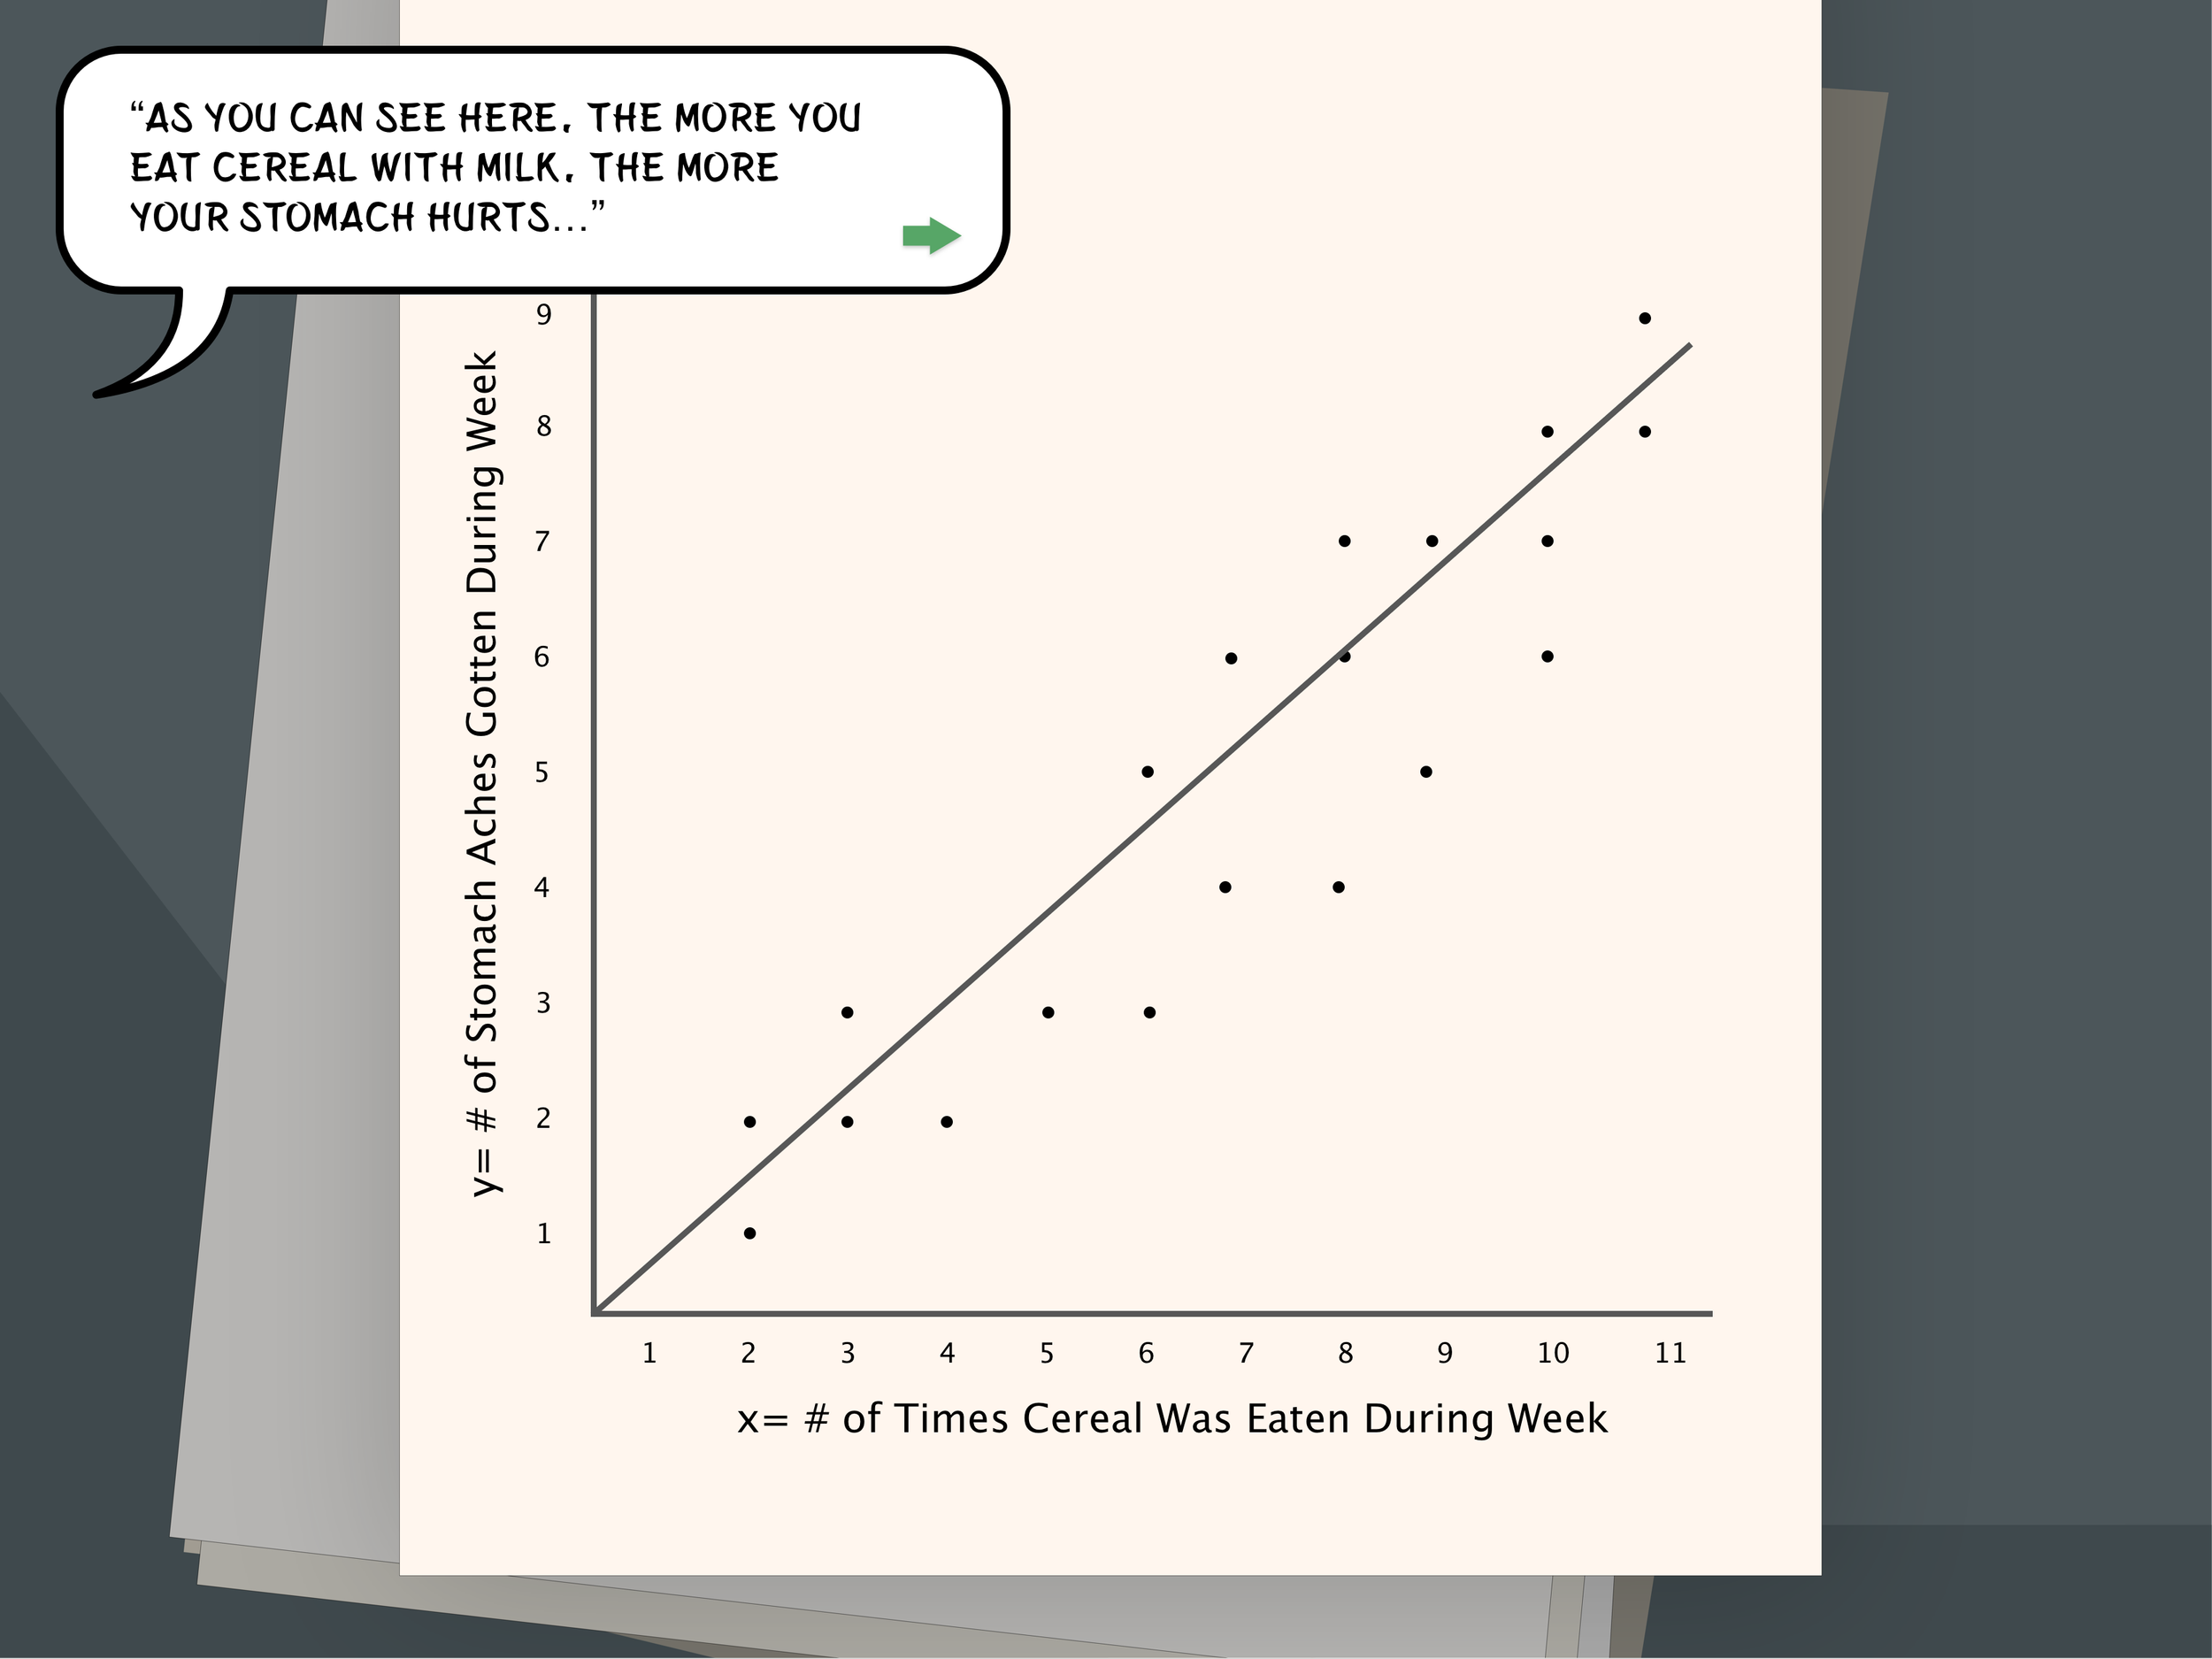
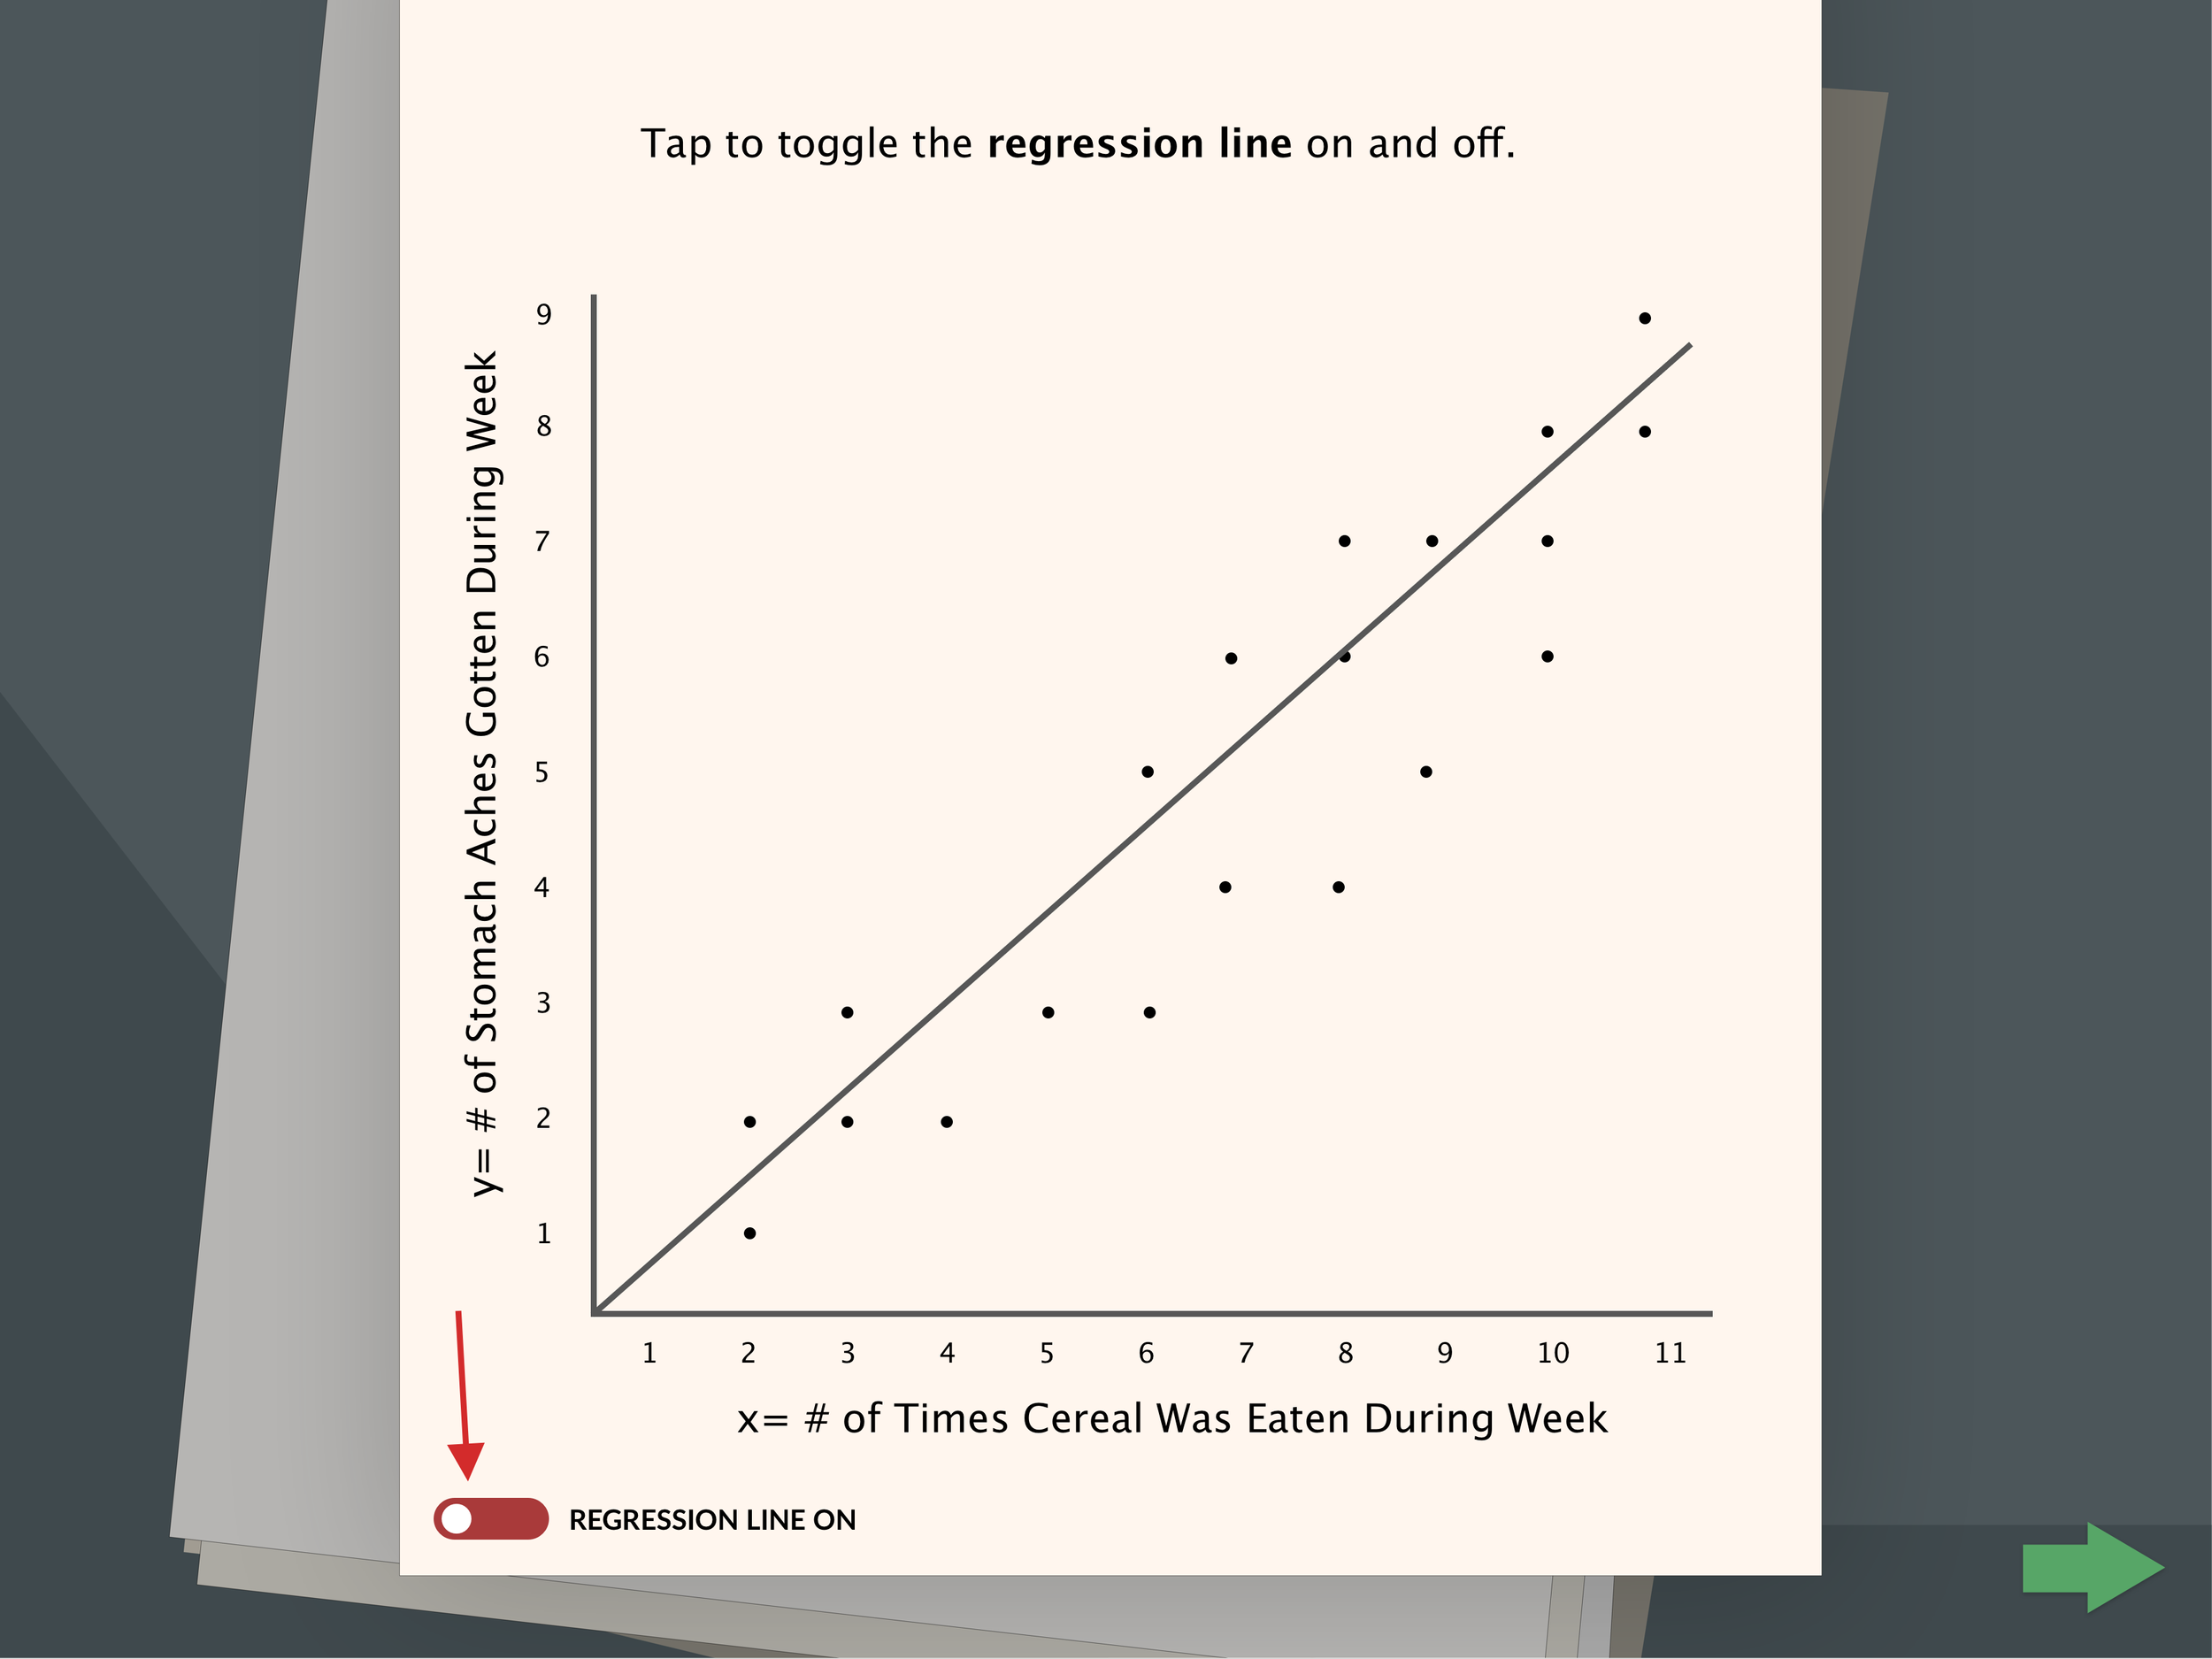
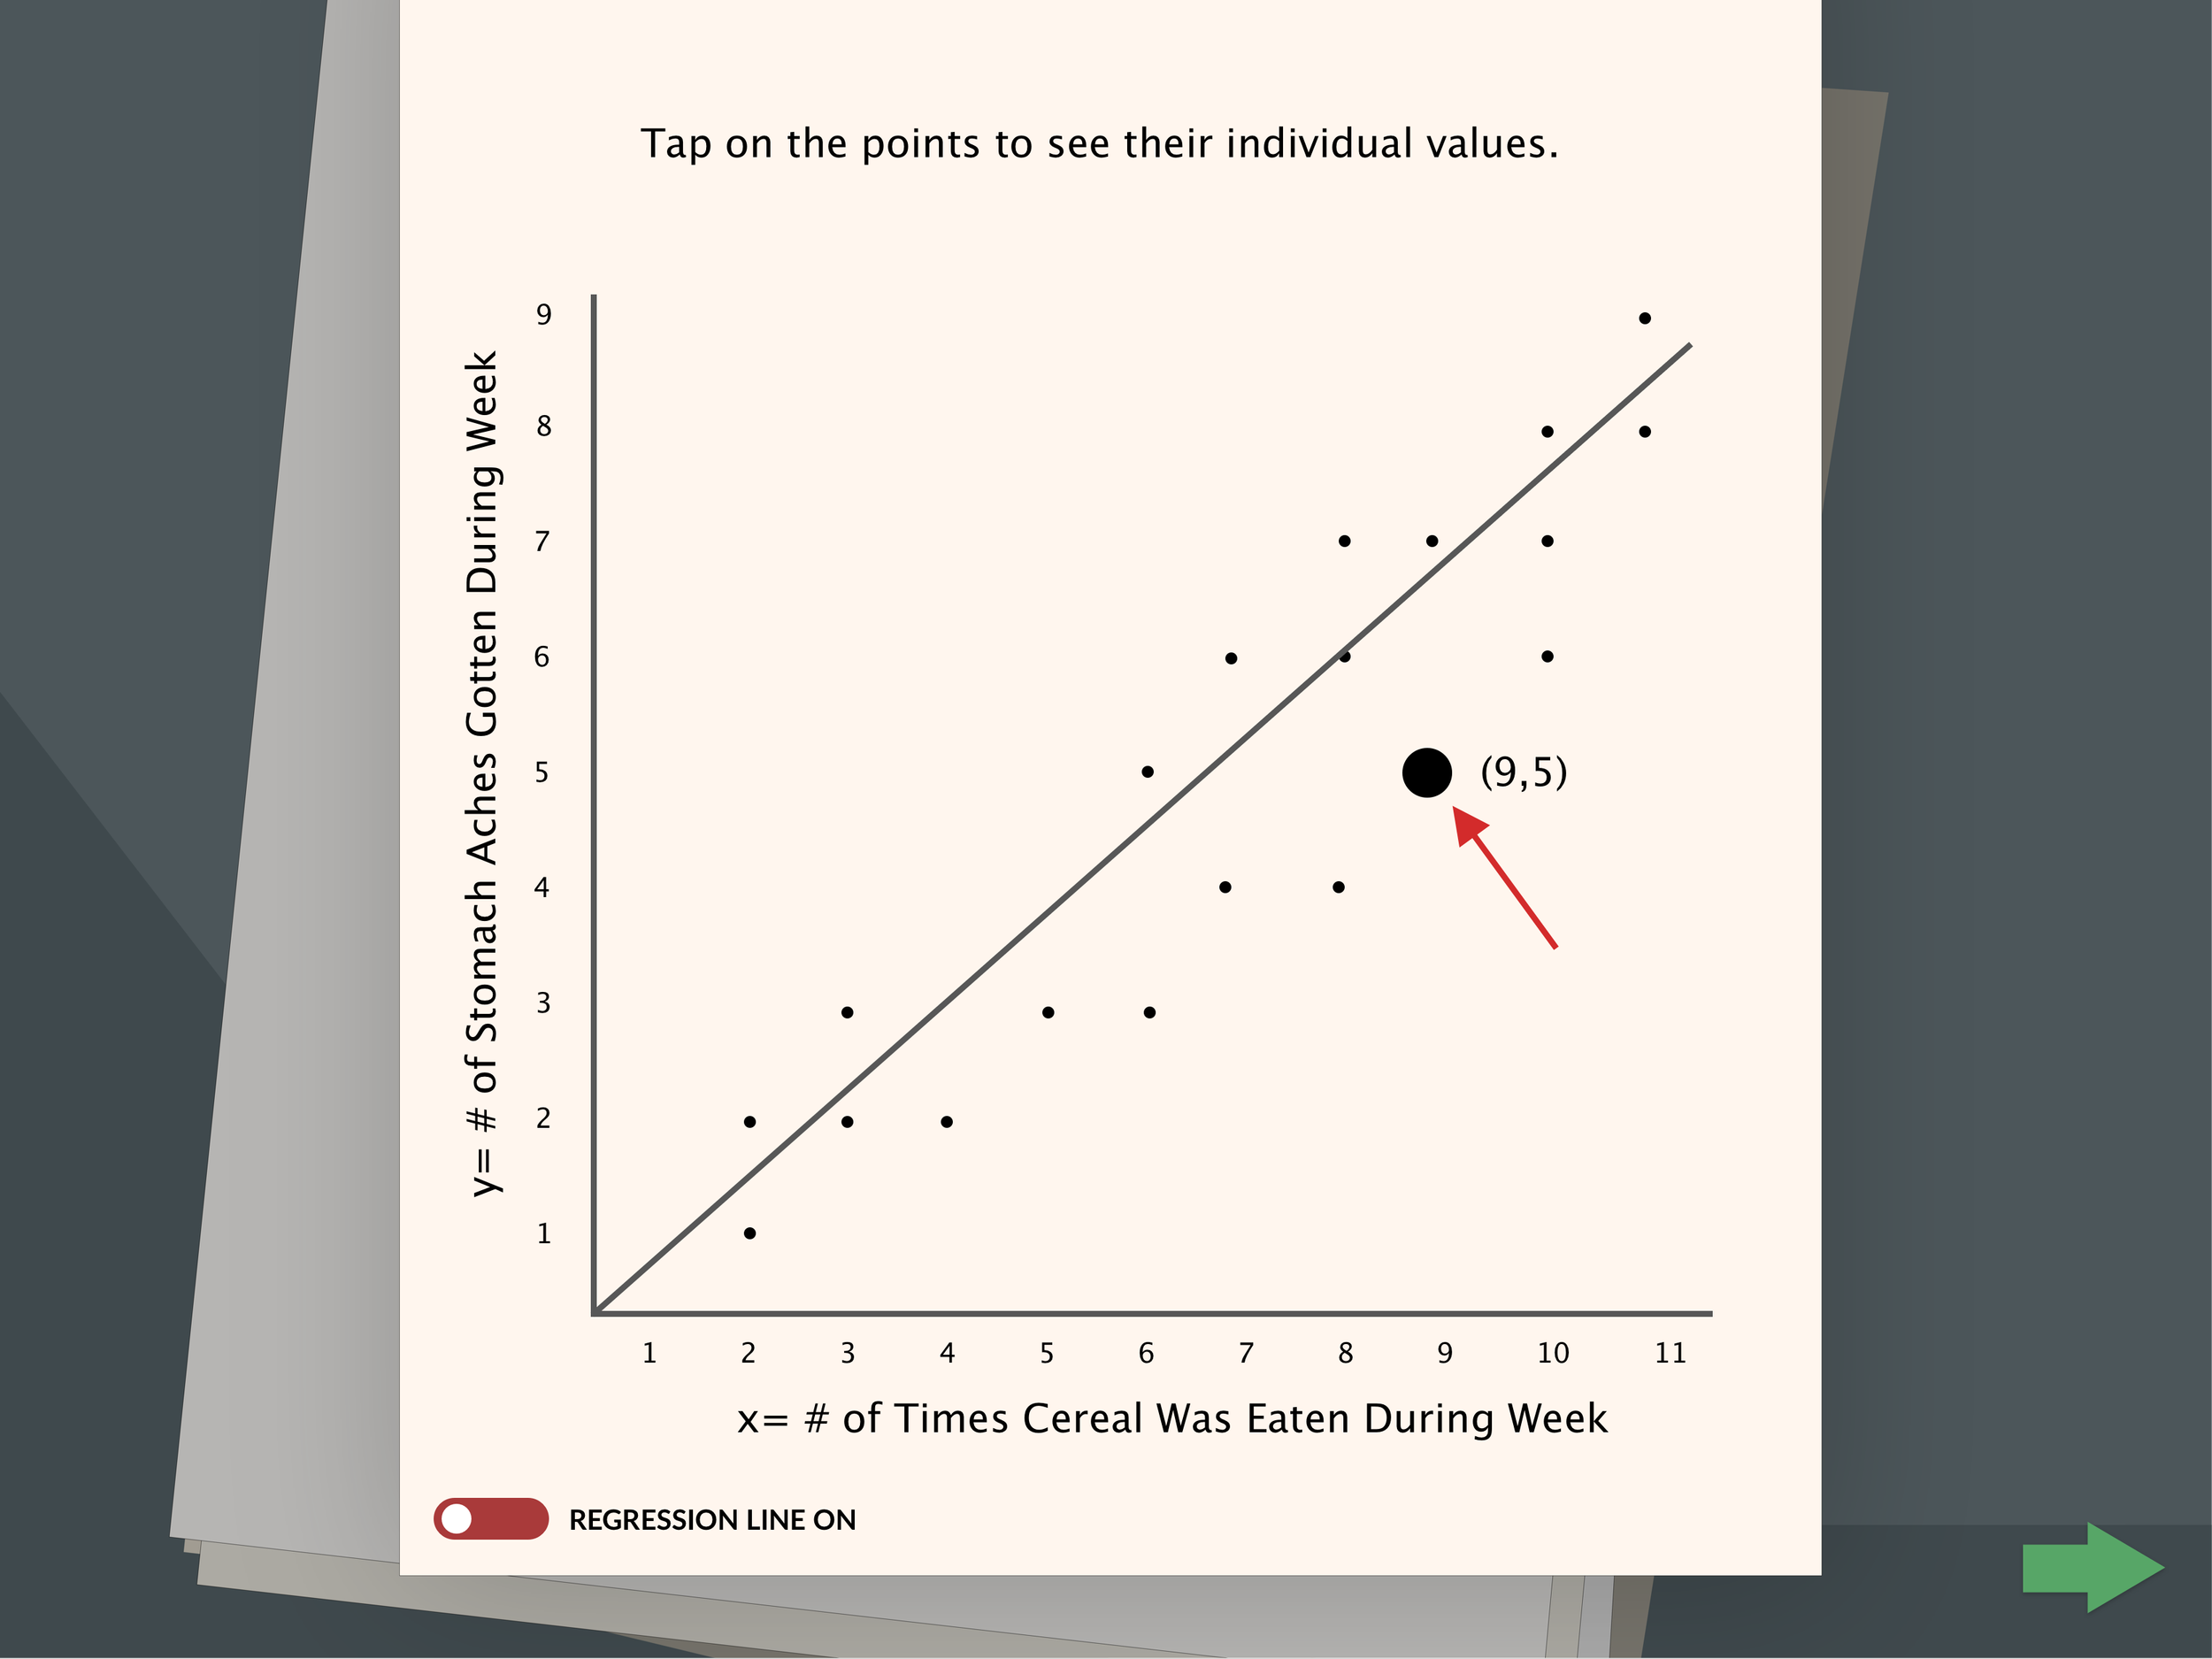
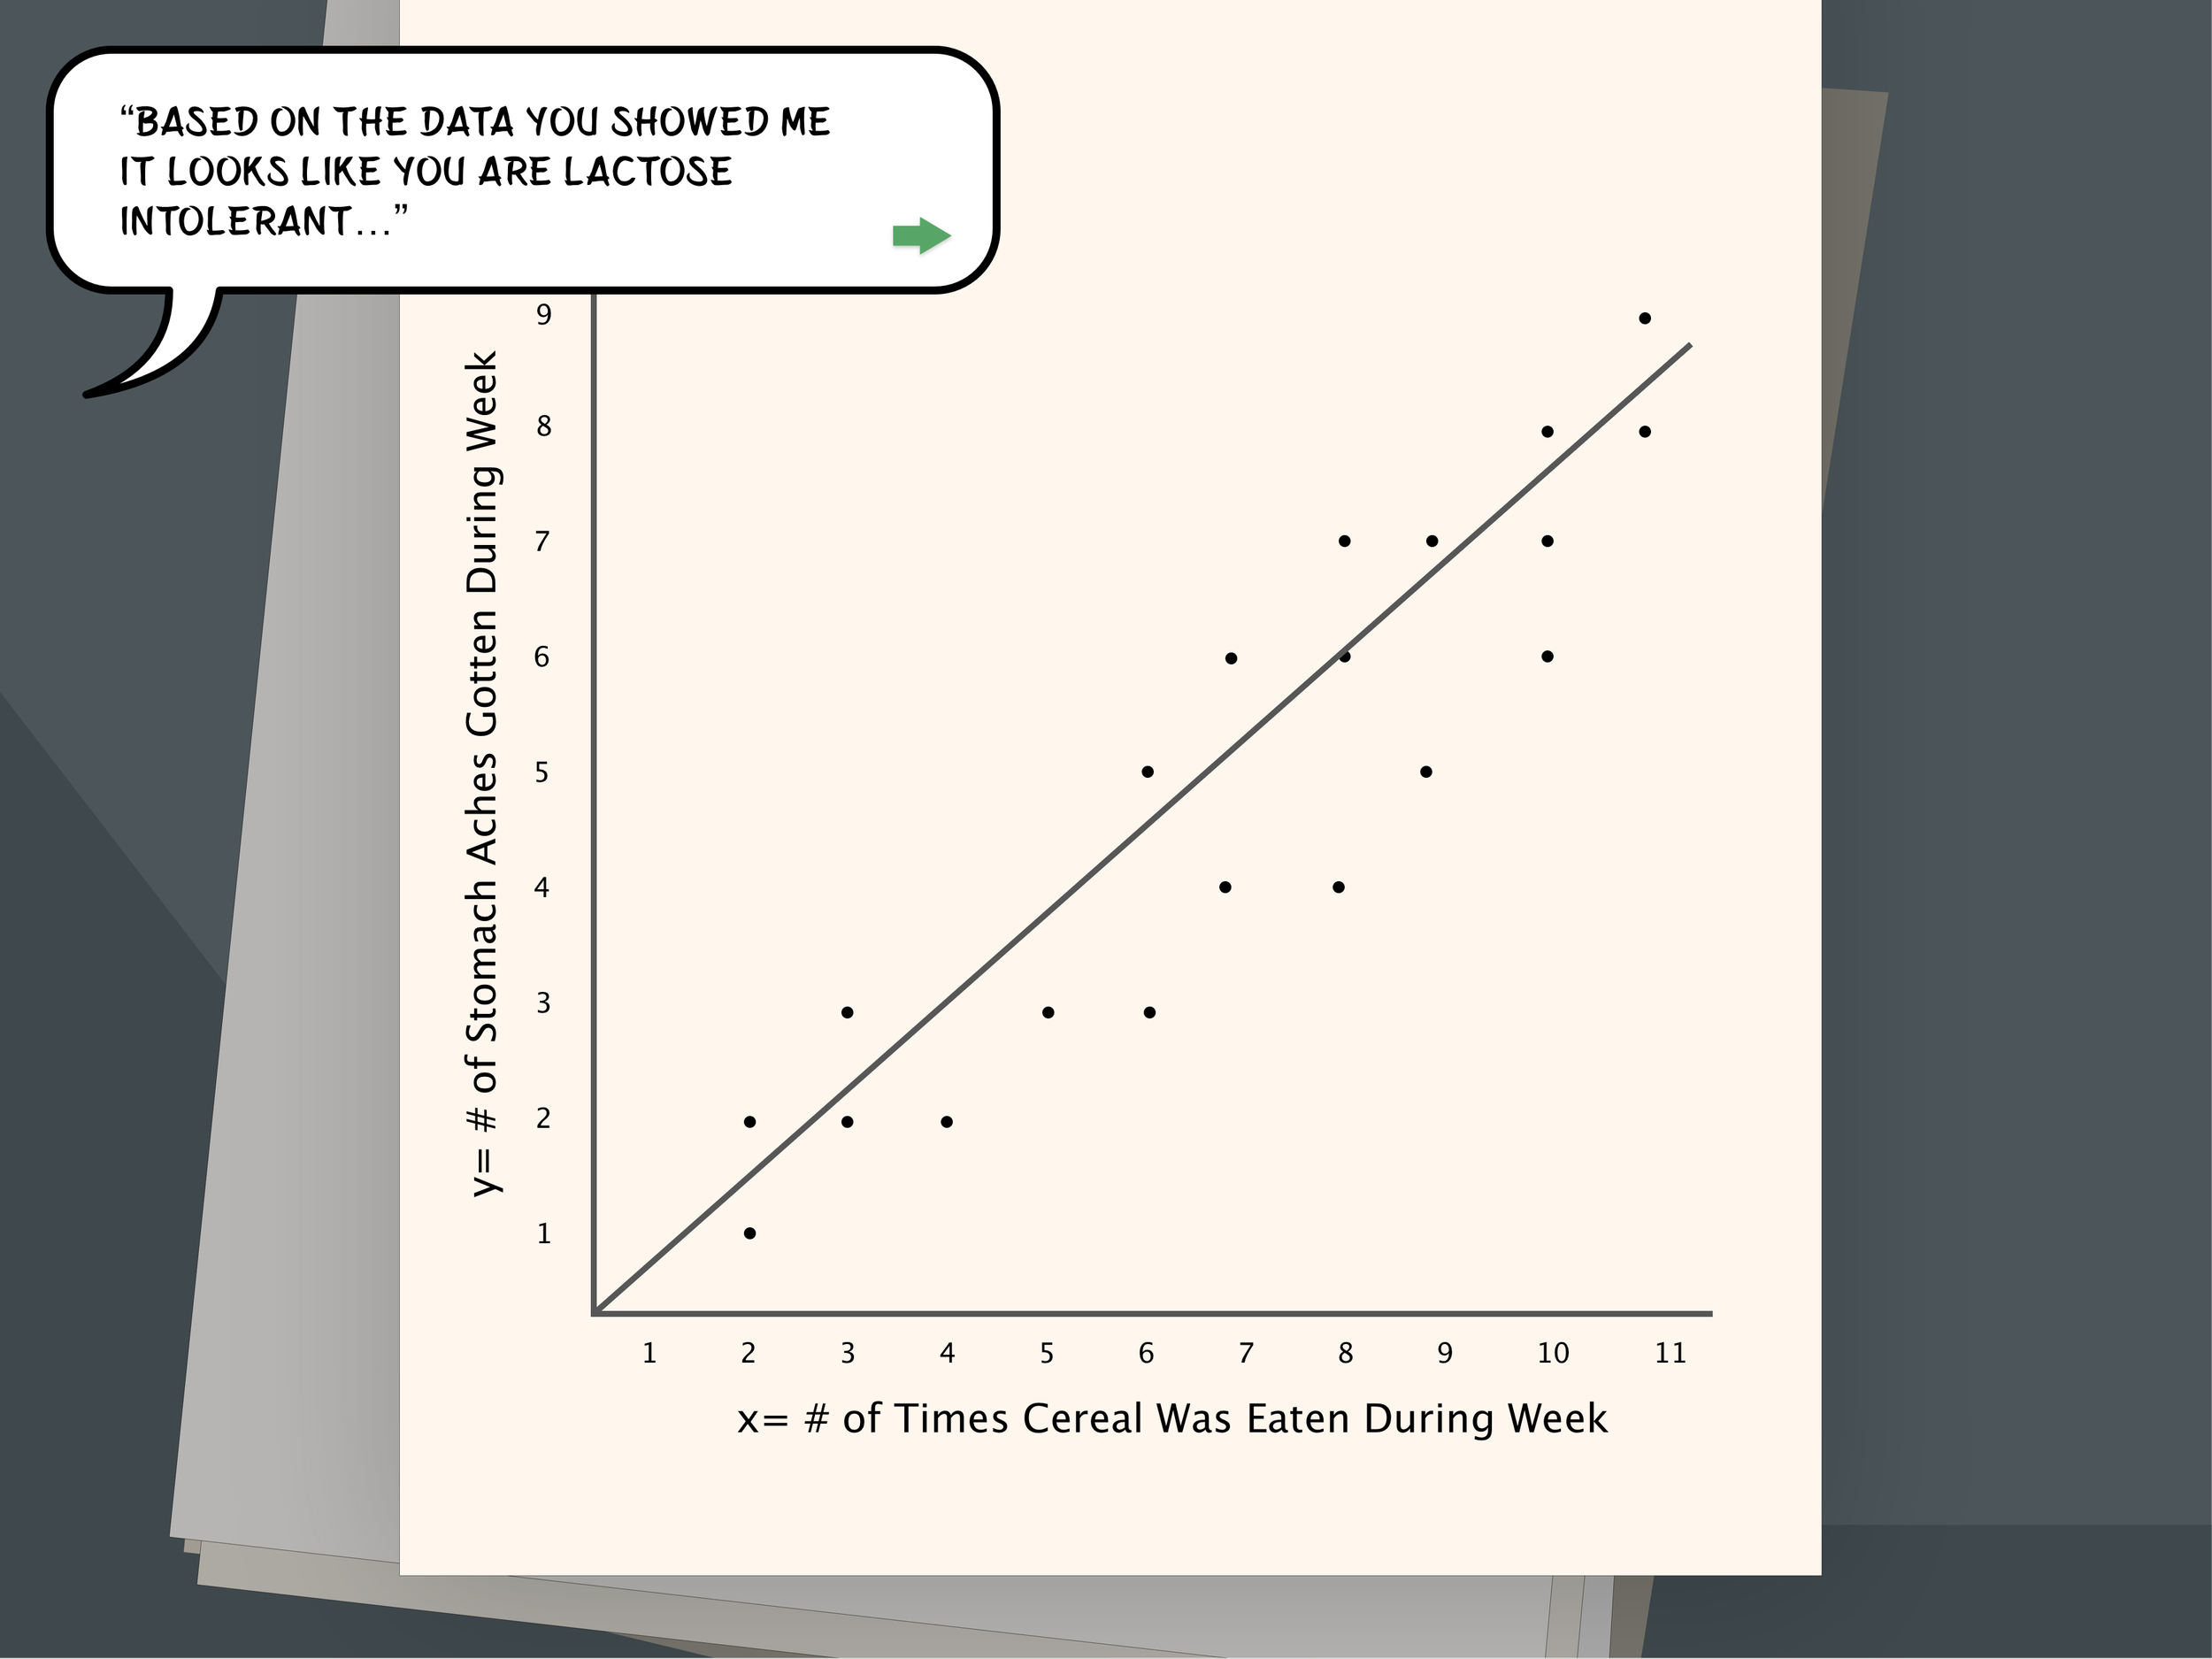
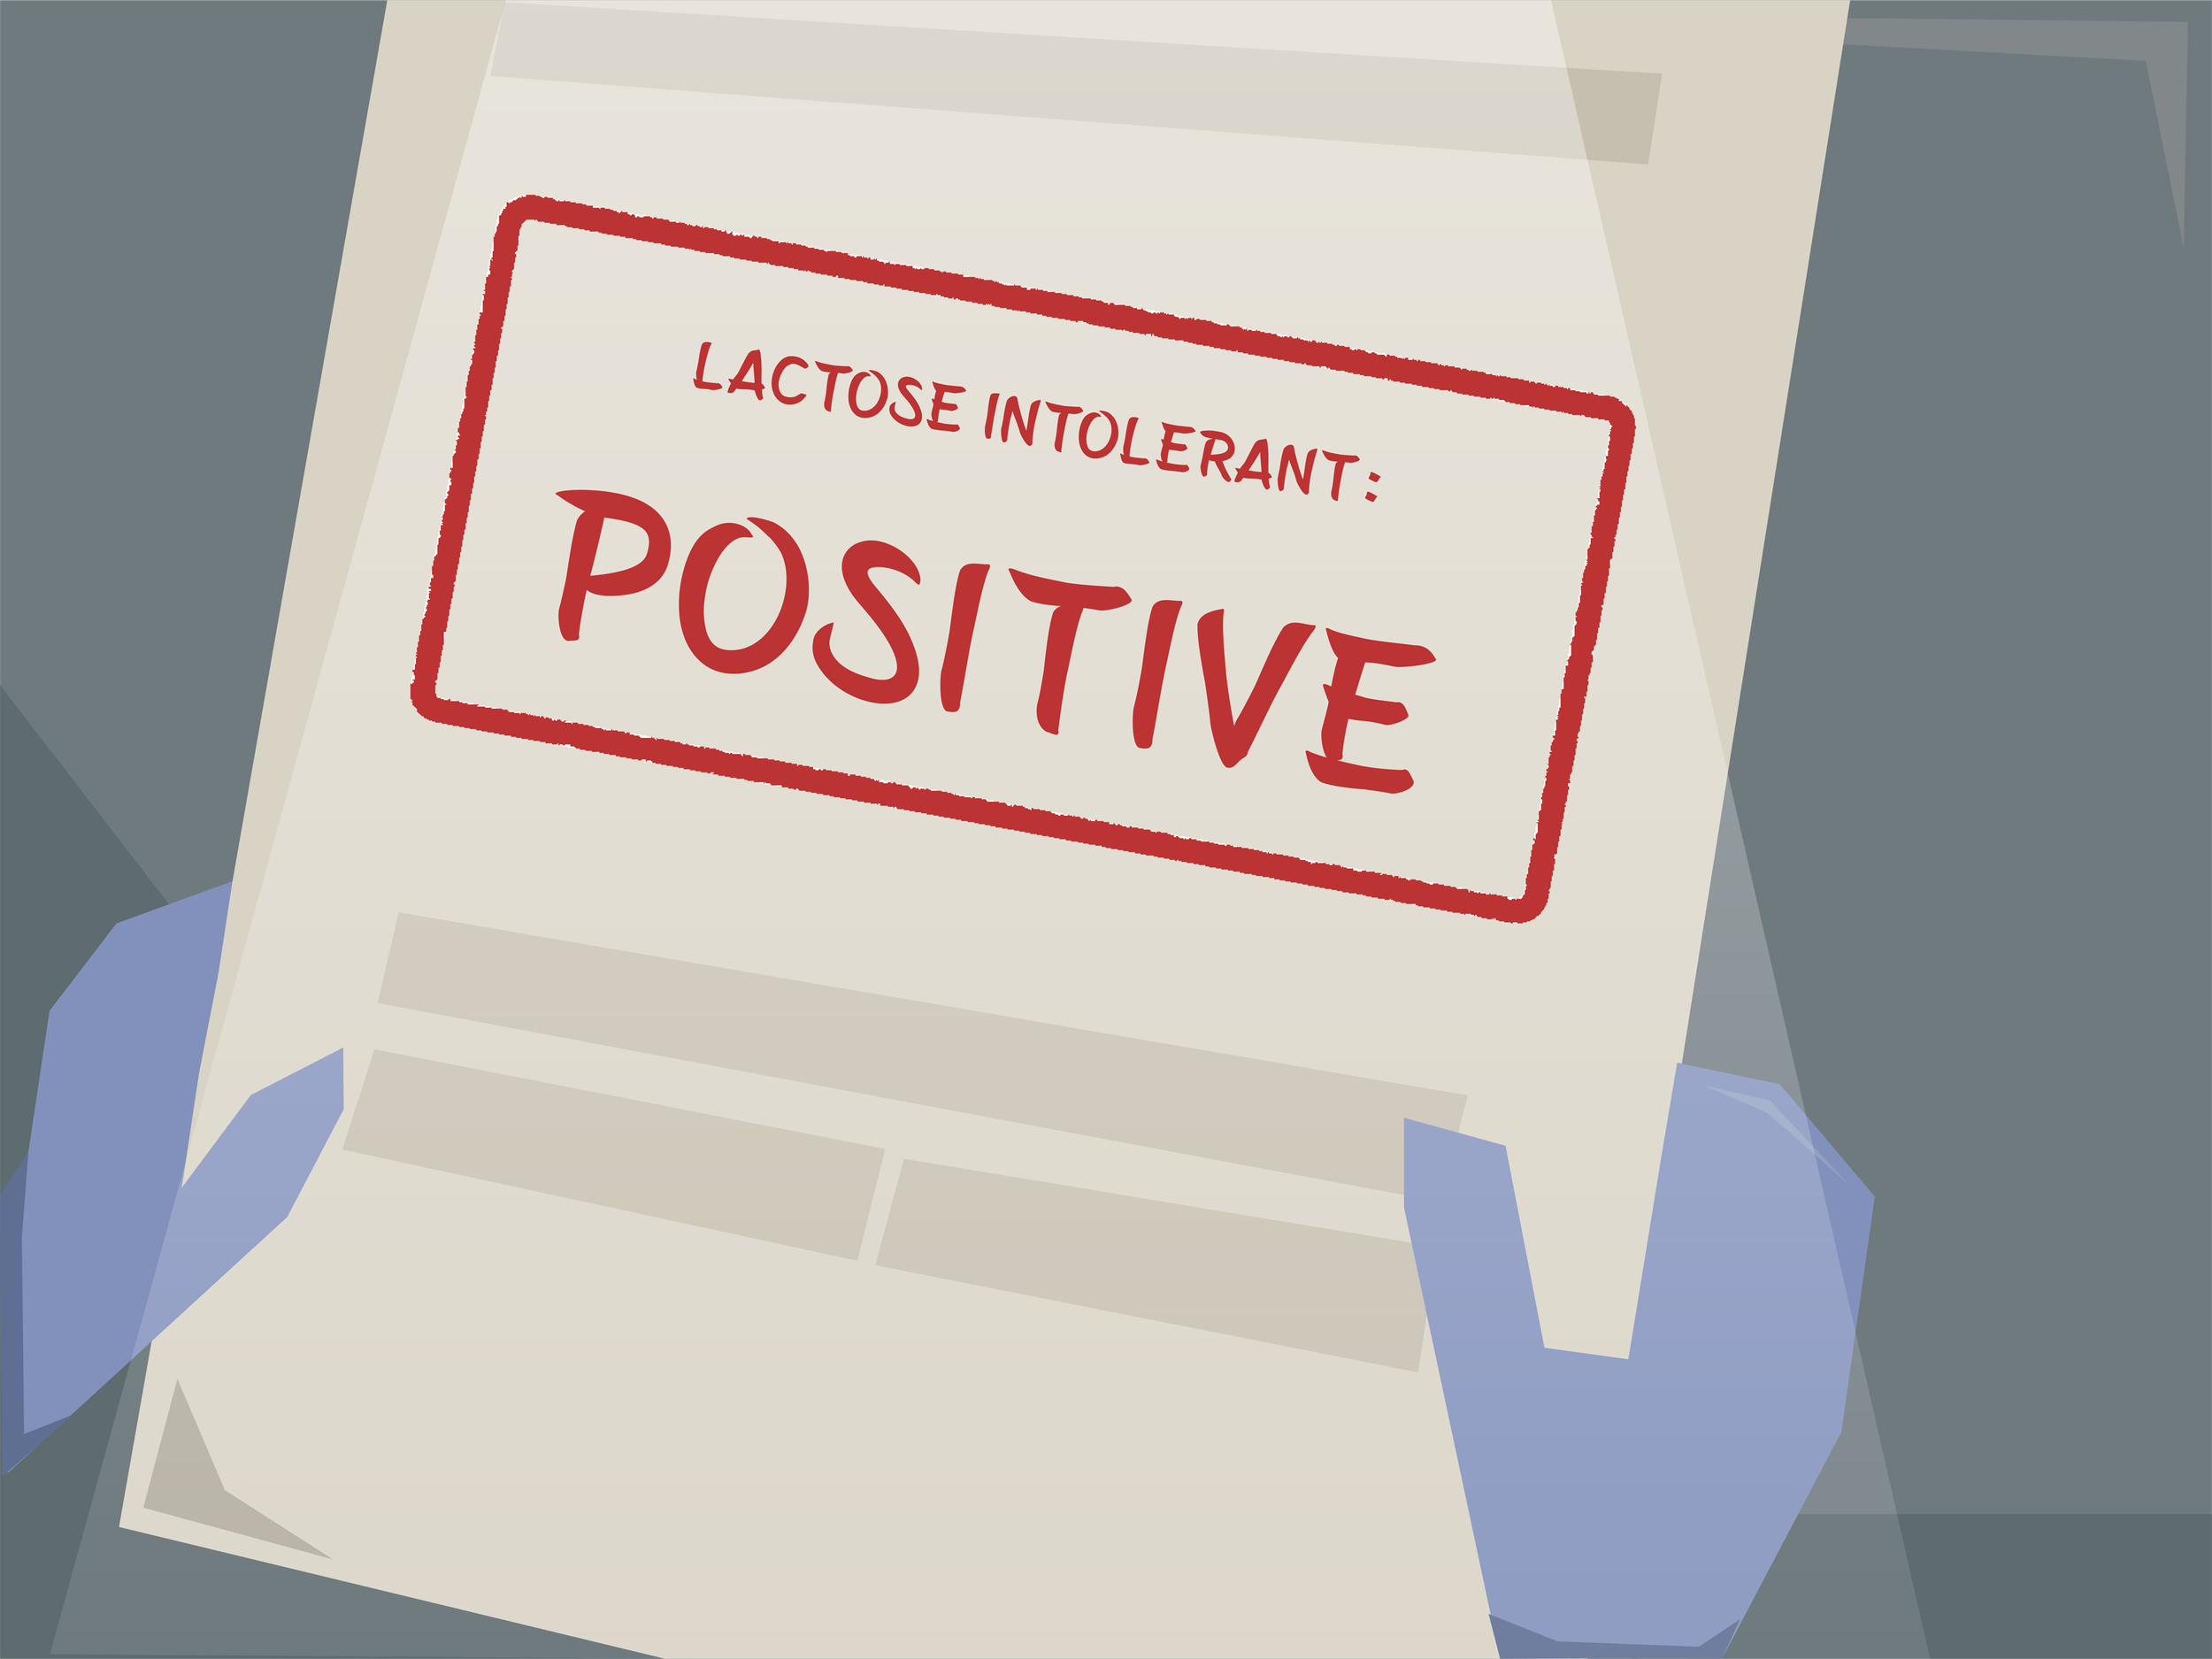
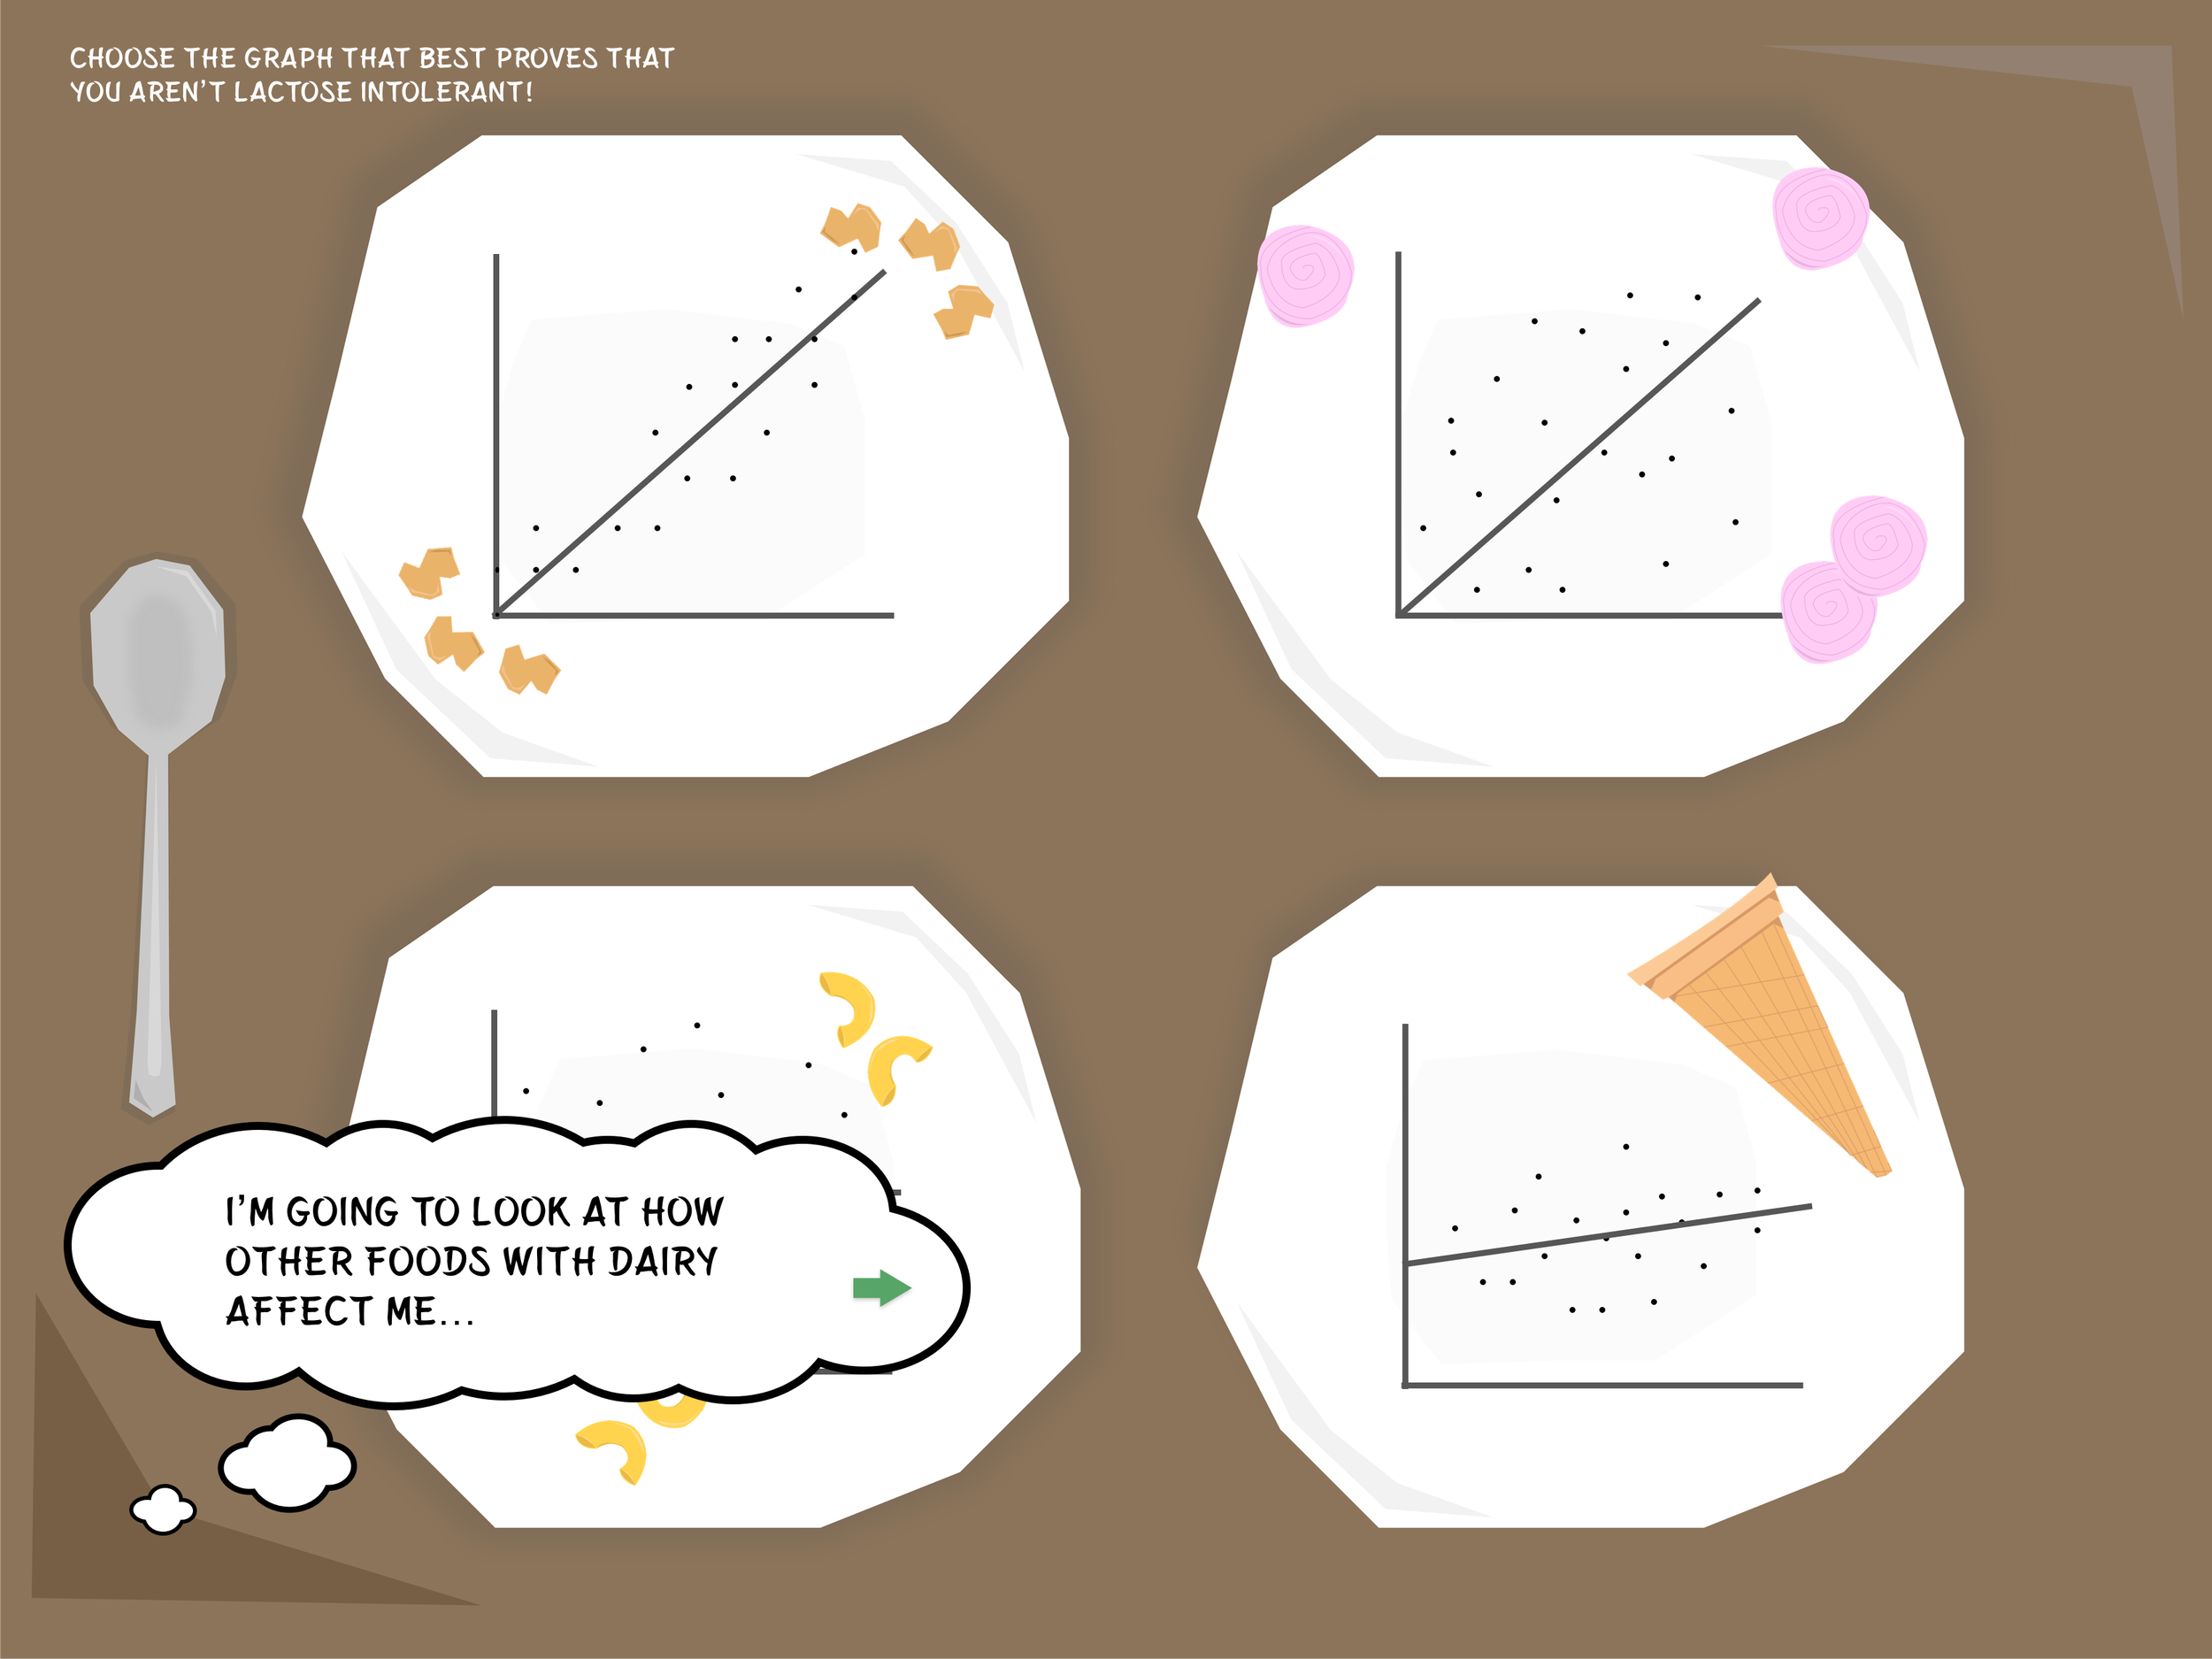
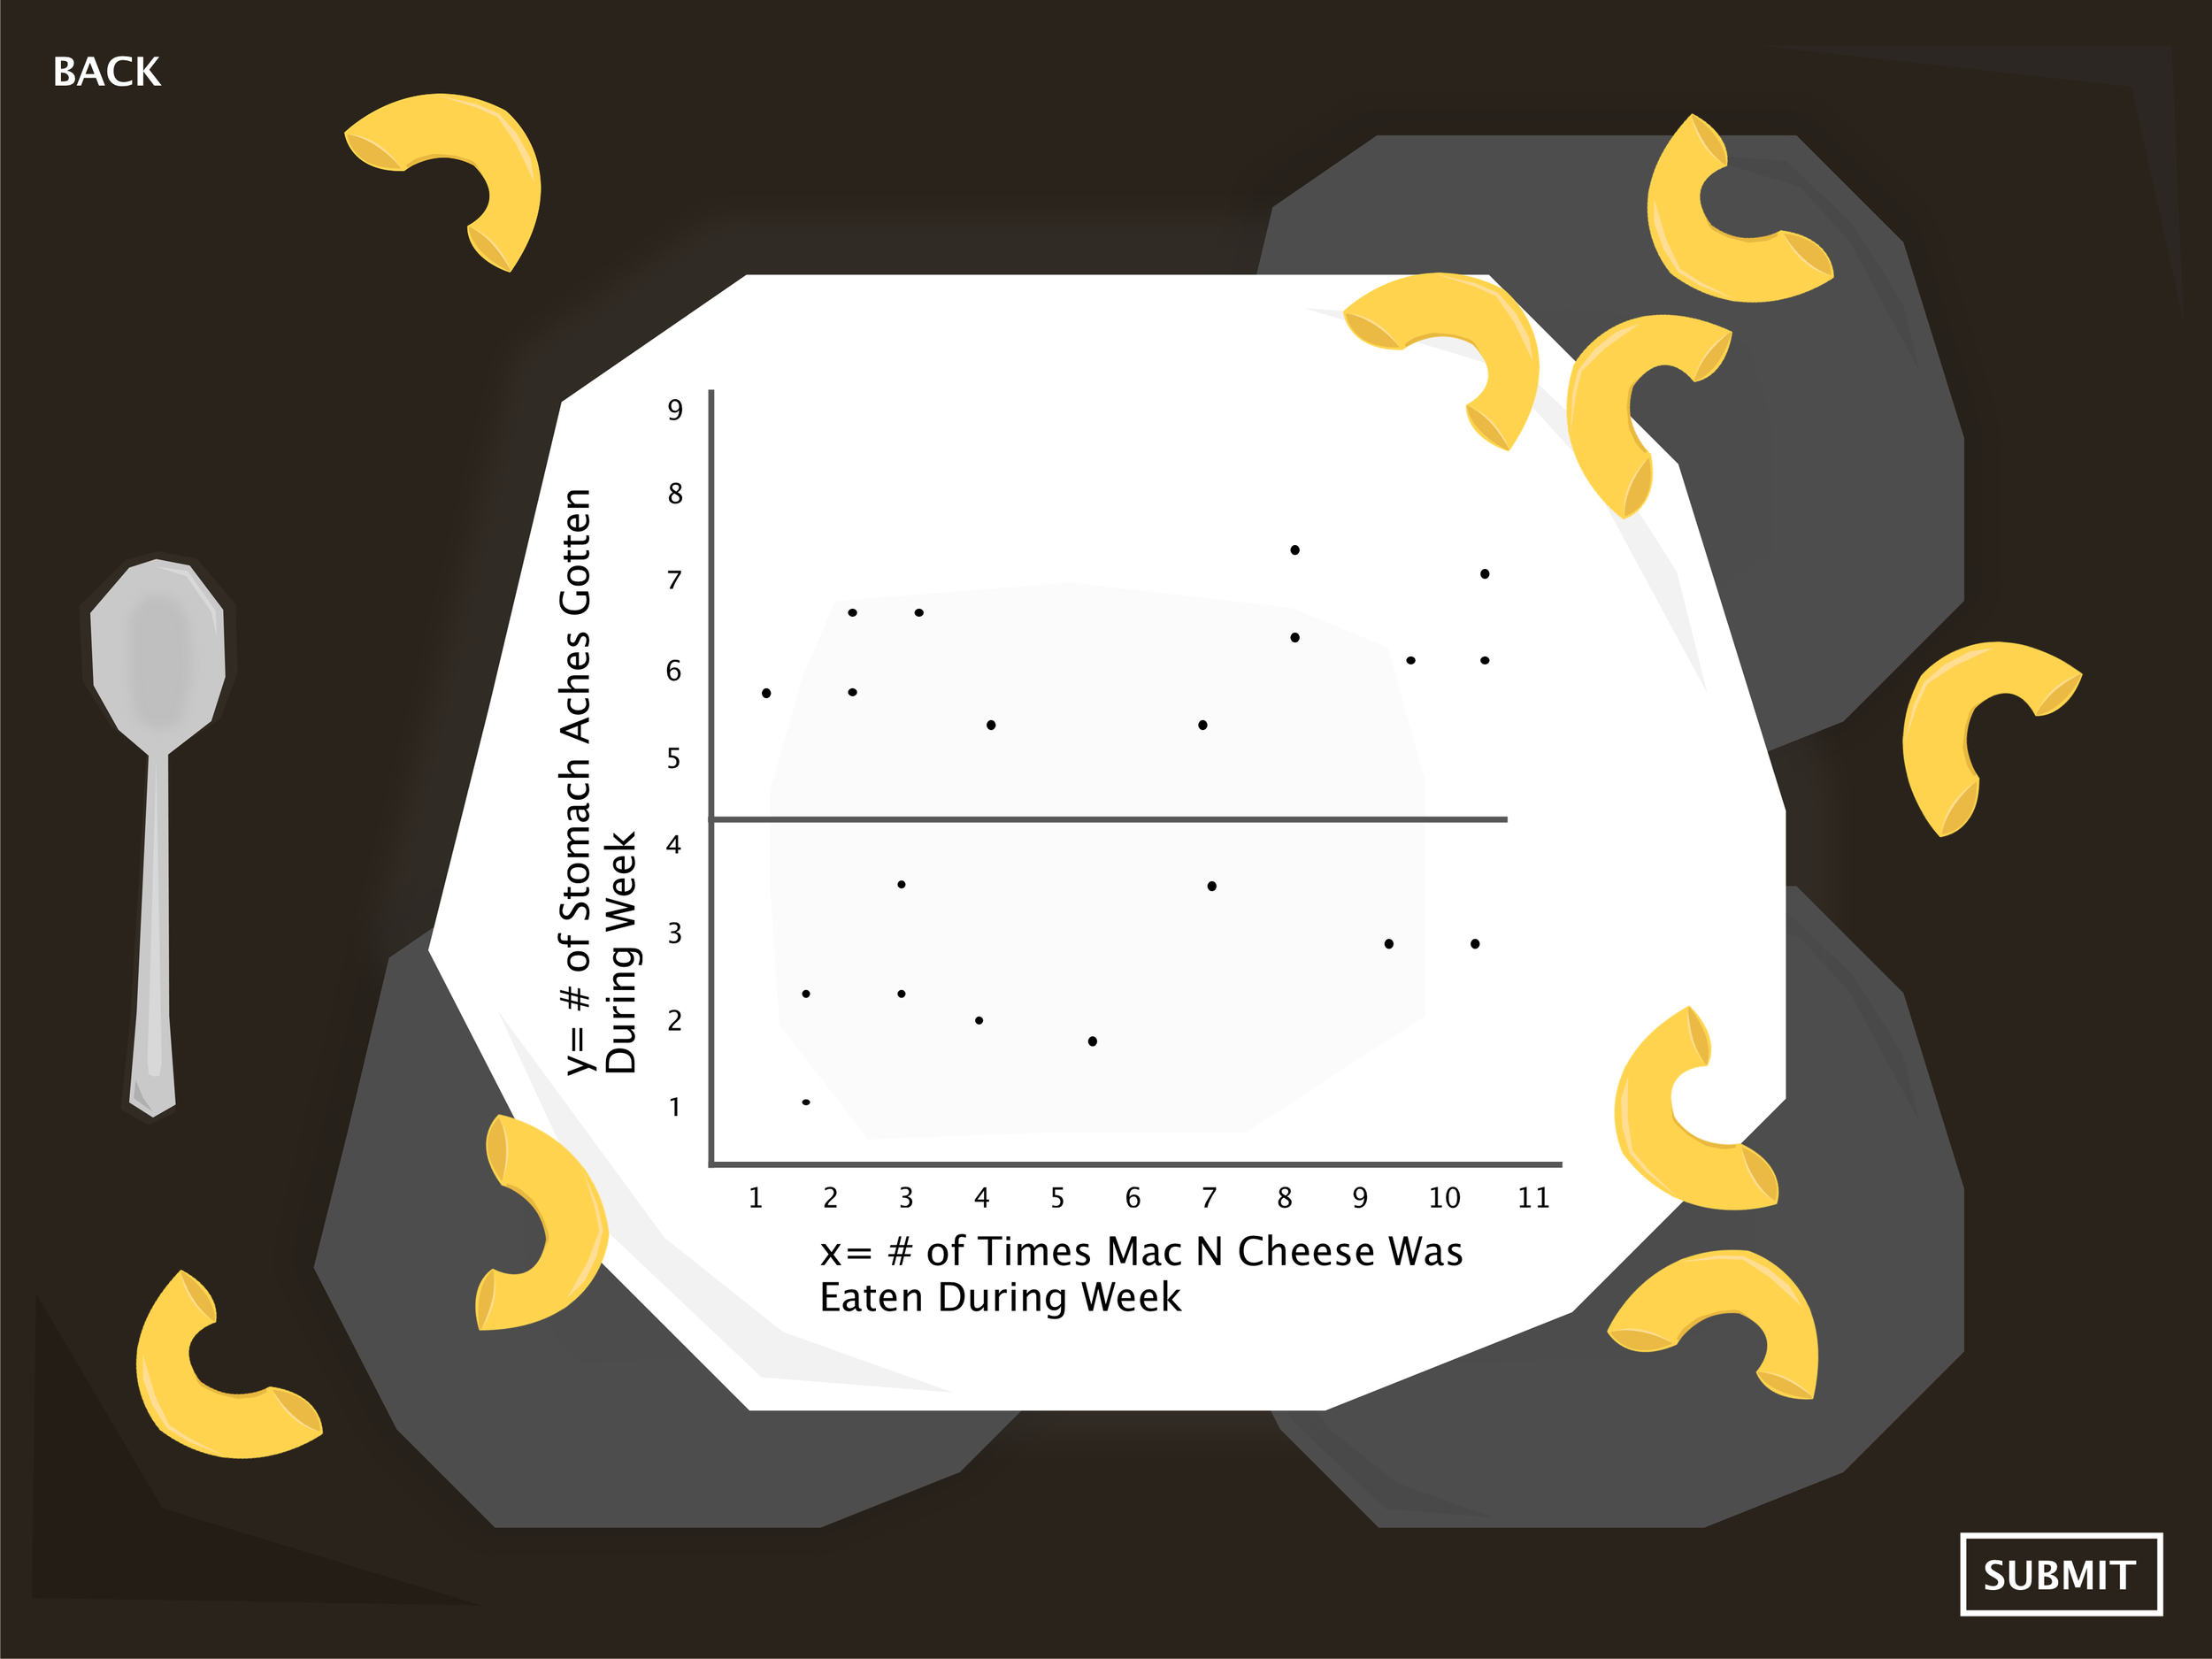
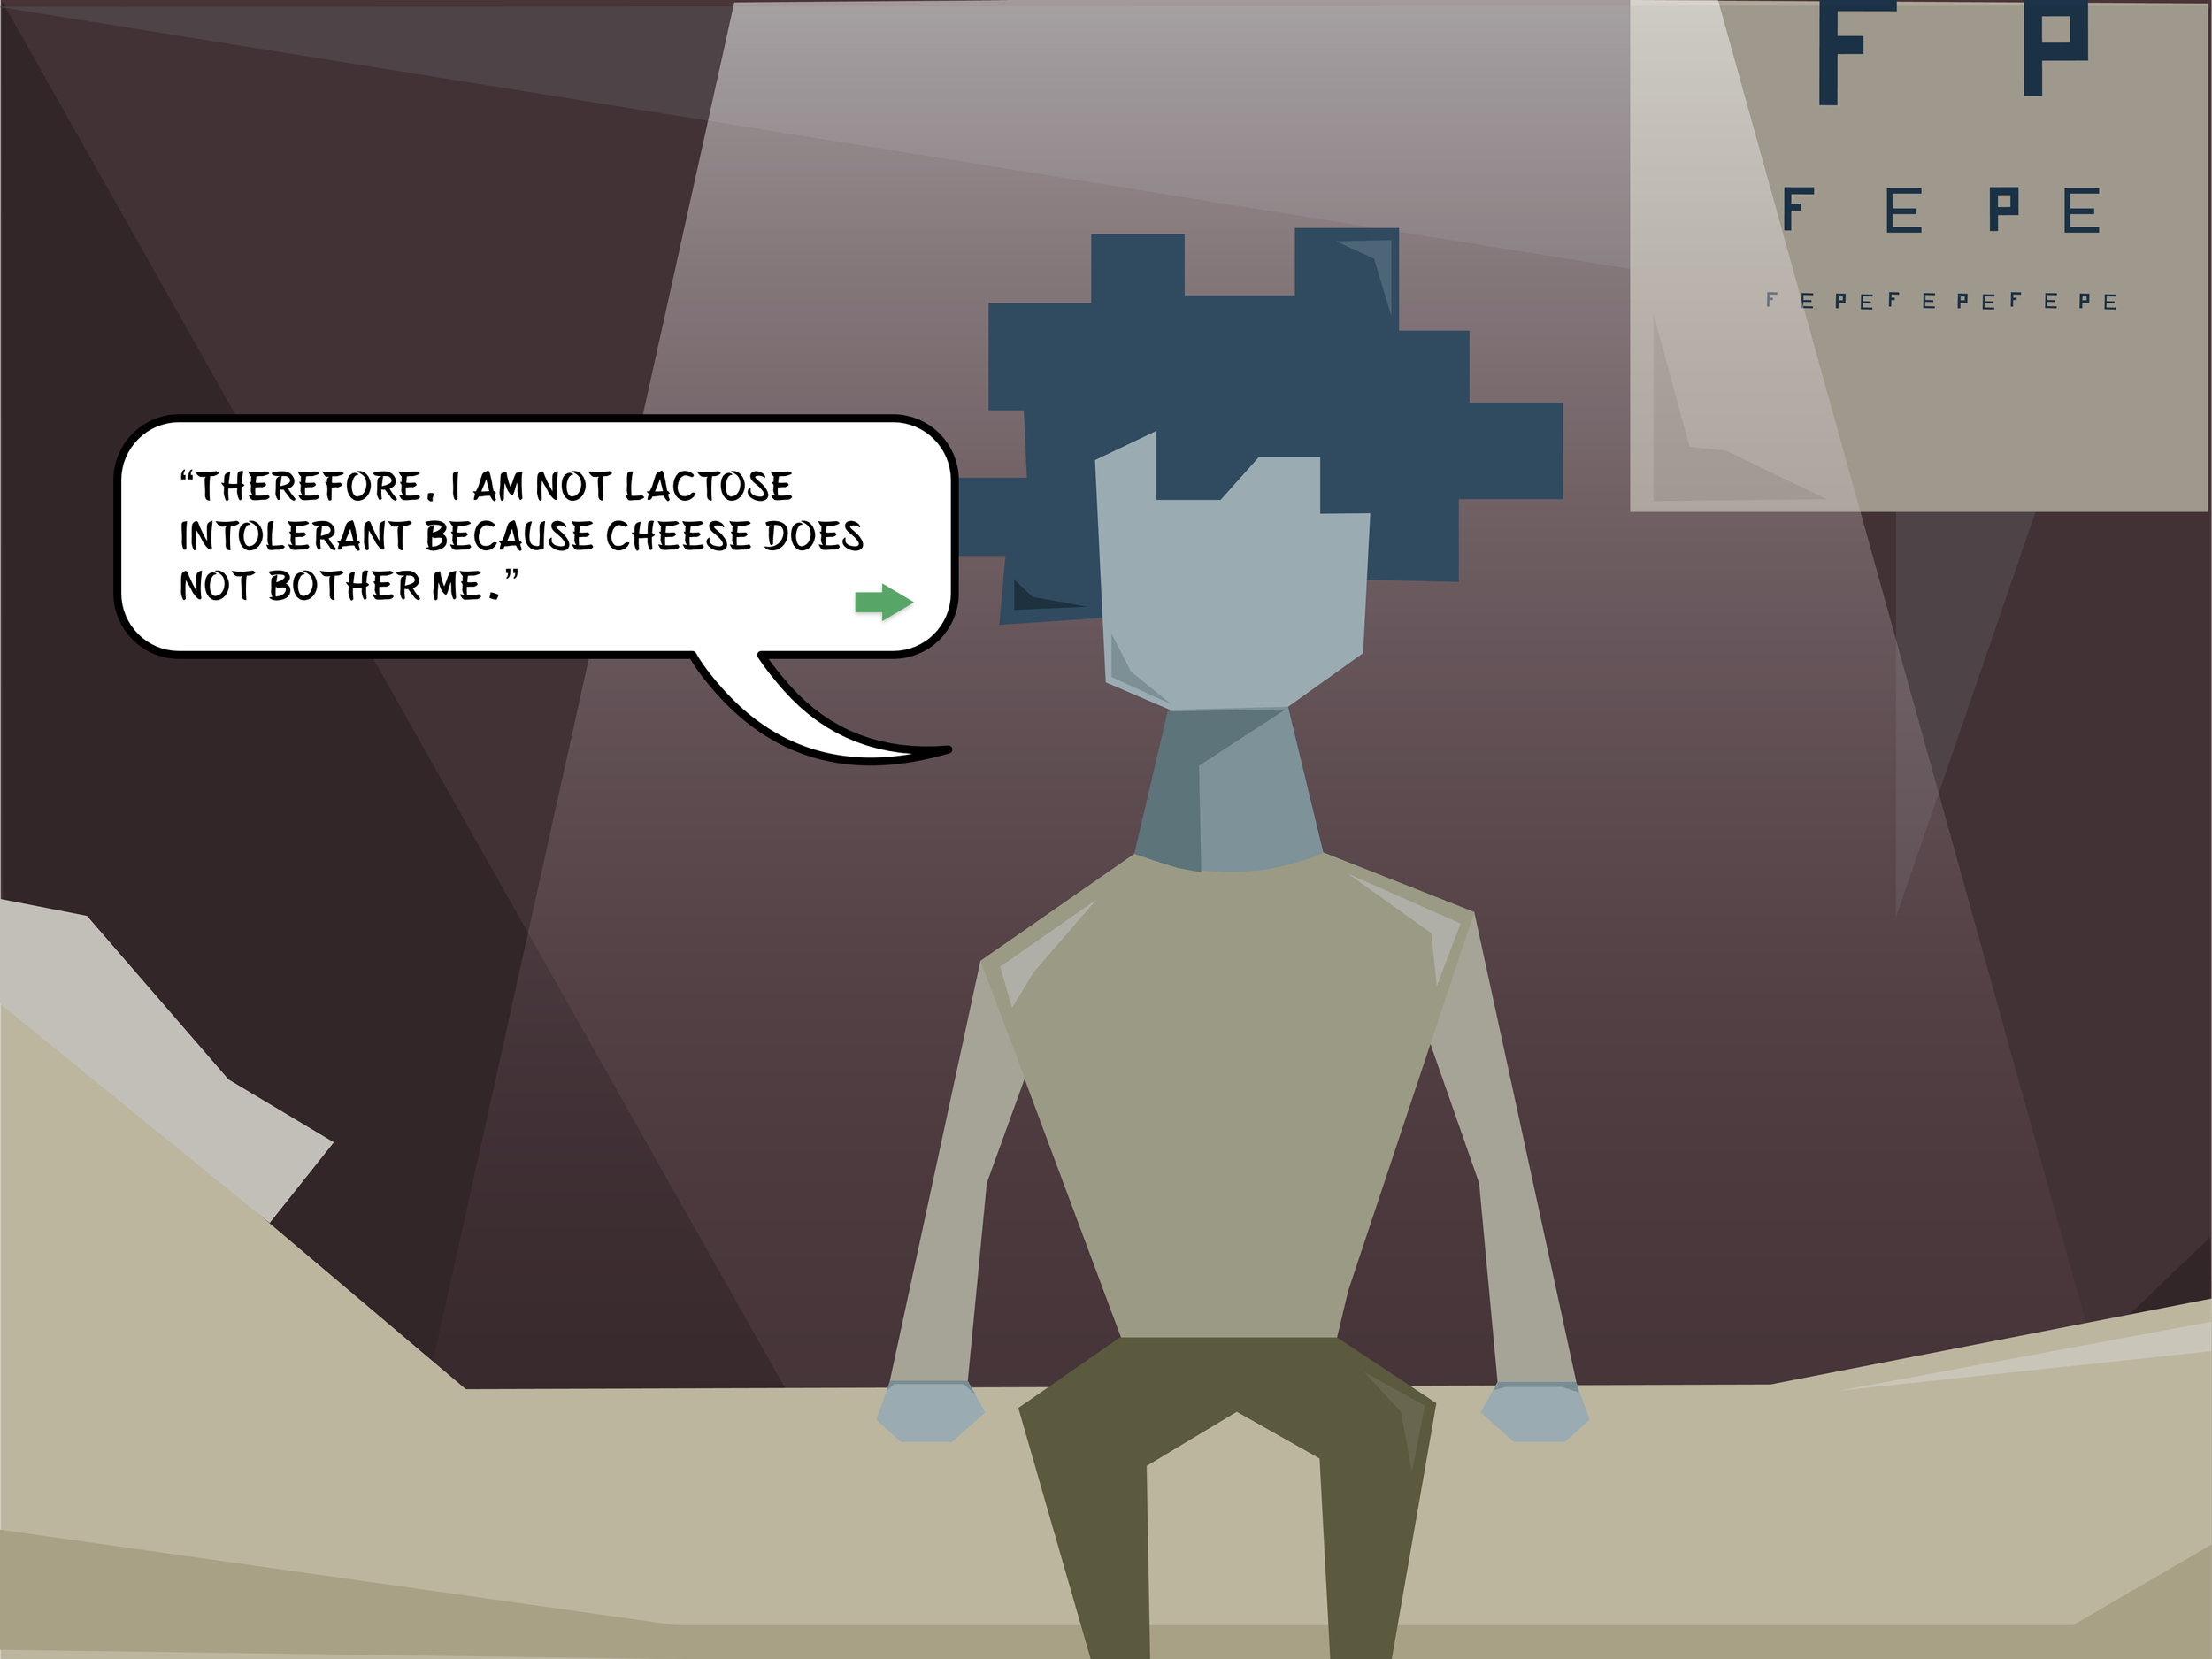
Our prototype was designed to be used on a tablet device. We used a combination of Sketch and InVision to create the prototype.
















Final Presentation
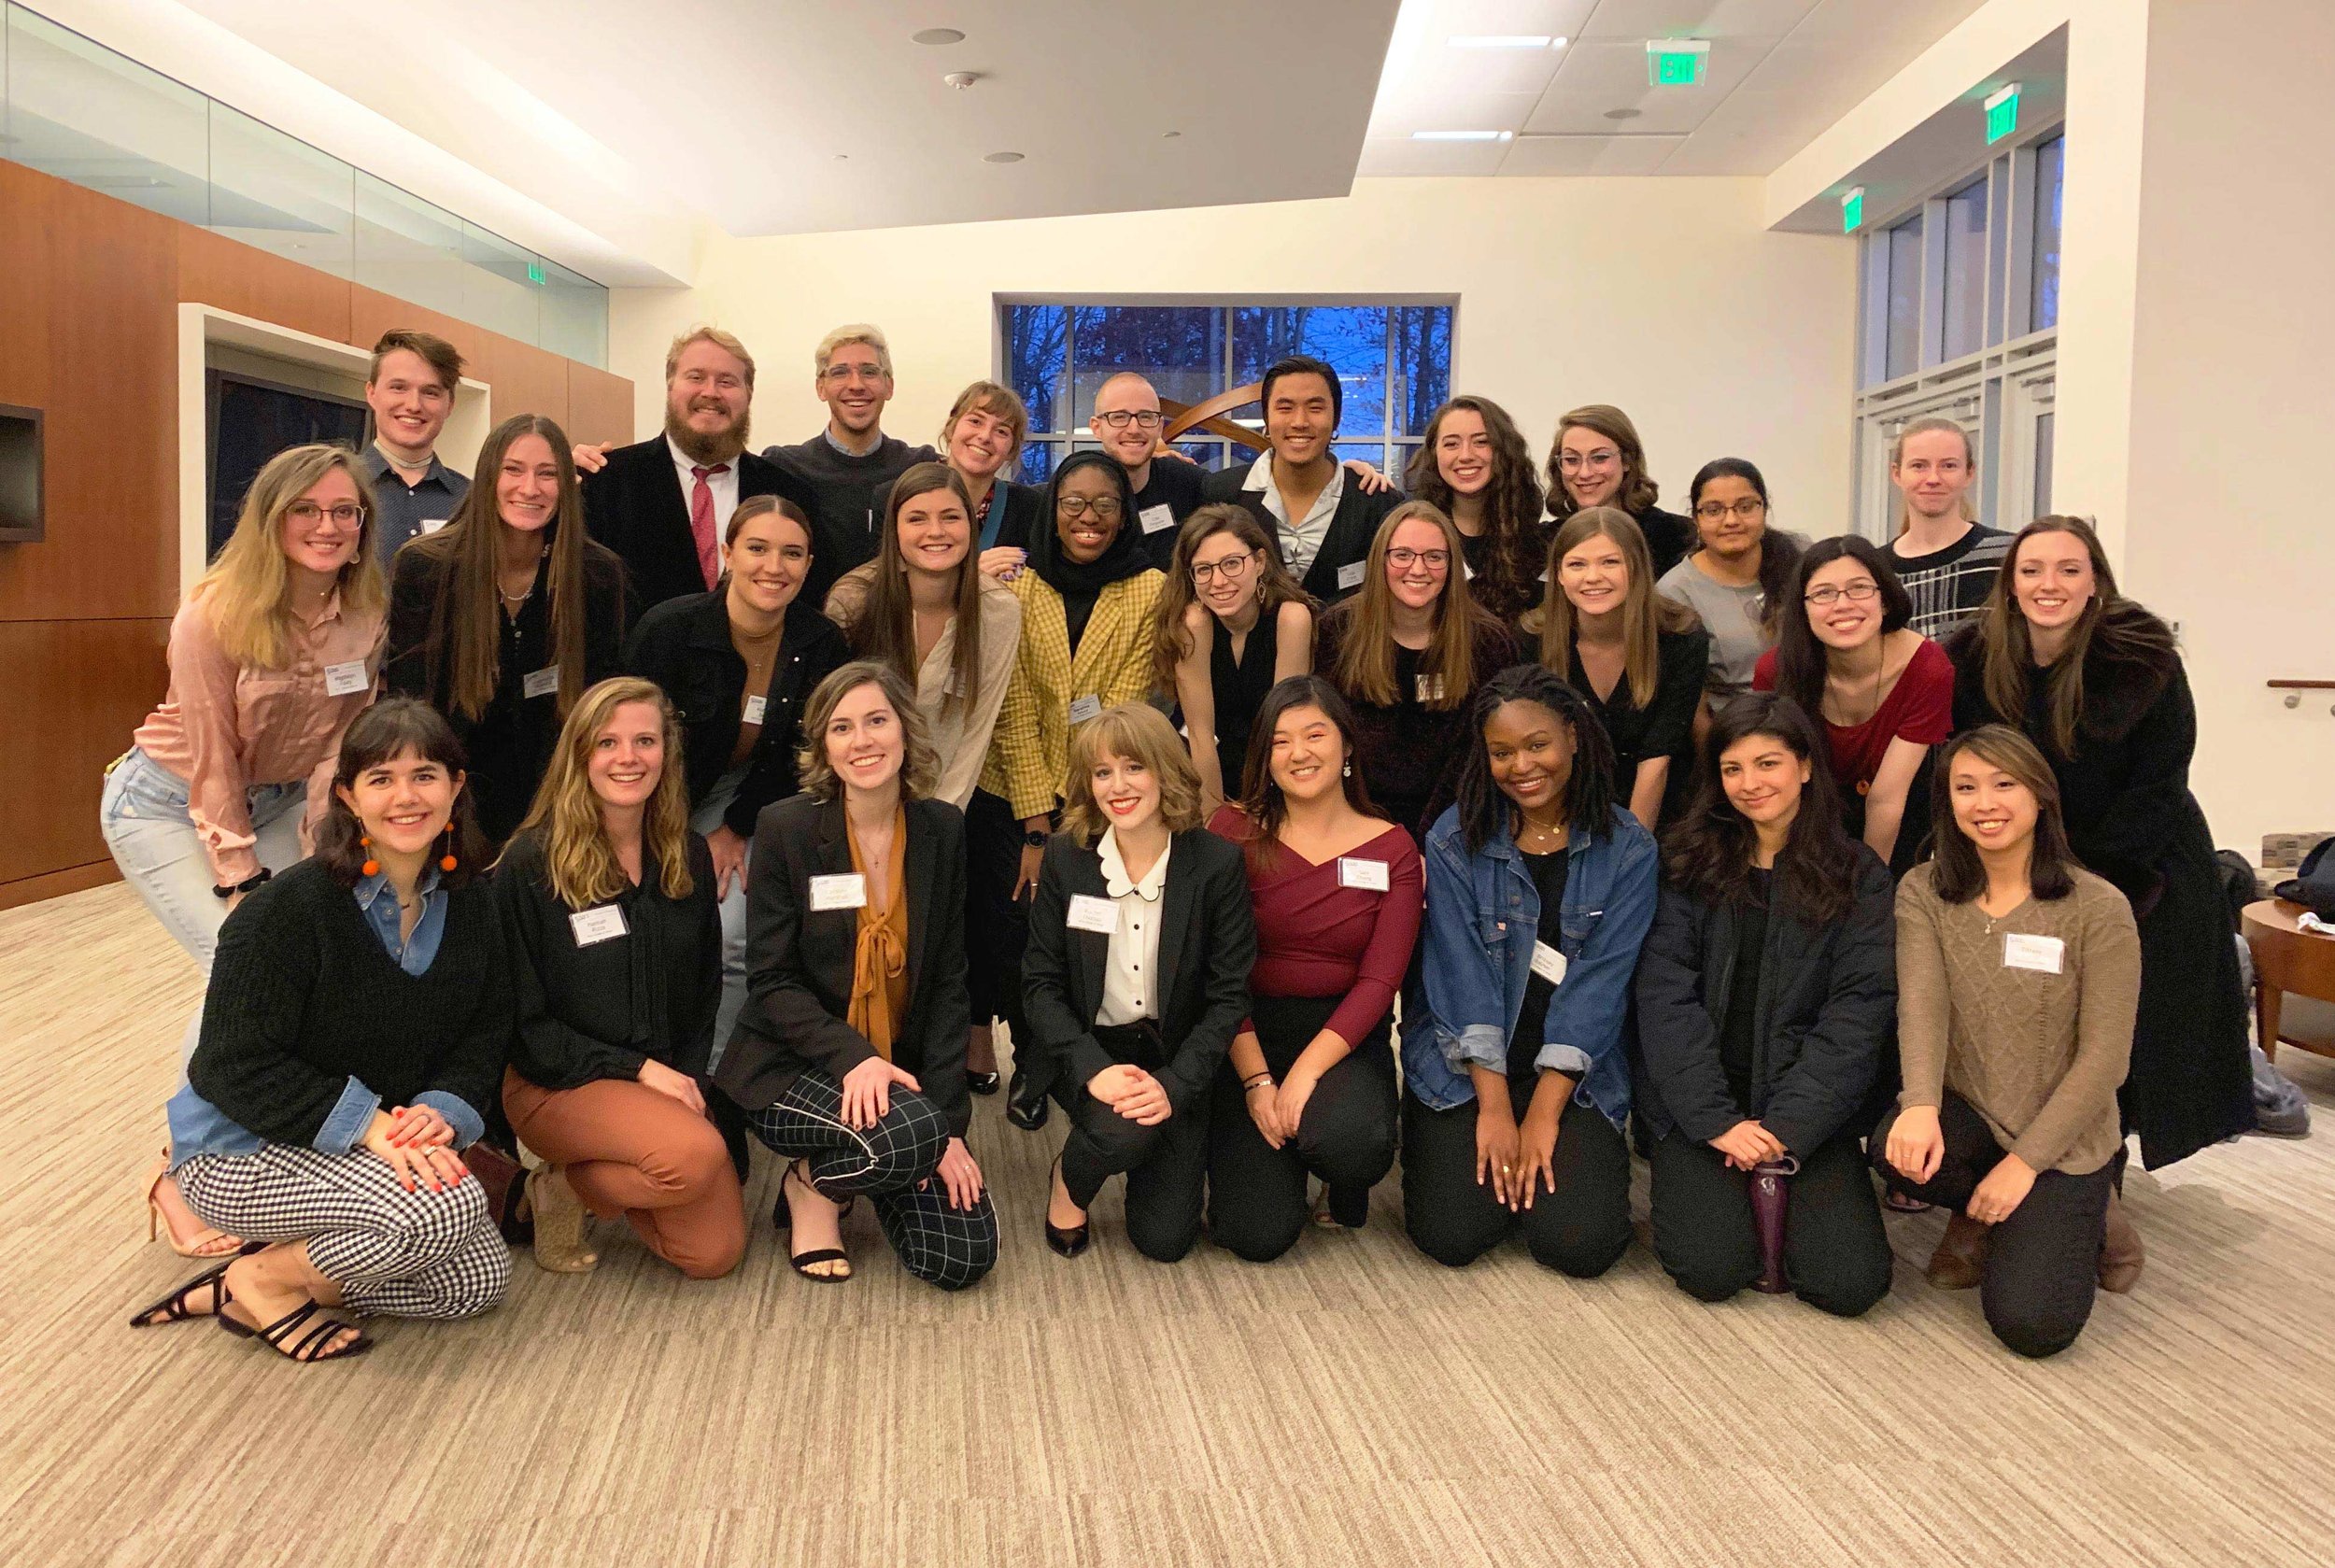
We created a solution video showing the features and functions of our interactive learning tool. Then, we presented our findings and solution to SAS staff and executives, as well as, the Dean of the Graphic Design department at NC State University.


